Download
1 / 44
440 likes | 523 Views
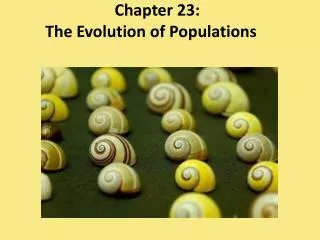
Chapter 23: The Evolution of a Population. Population. Group of individuals in a geographic location, capable of interbreeding and producing fertile offspring. Natural selection acts on individuals, but only populations evolve. Galapagos Islands.

E N D
Population Group of individuals in a geographic location, capable of interbreeding and producing fertile offspring Natural selection acts on individuals, but only populations evolve
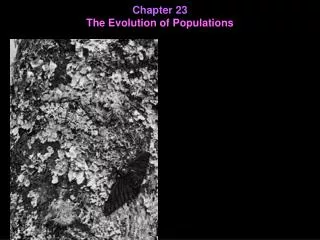
Galapagos Islands • Population of medium ground finches on Daphne Major Island • During a drought, large-beaked birds were more likely to crack large seeds and survive • Evolution by natural selection
Types of Evolution • Microevolution= change in the gene pool of a population over many generations • 4 Methods of Microevolution • Mutations • Natural Selection • Genetic Drift= chance events cause genetic changes from one population to the next • Gene Flow= individuals or gametes move to a different population
Genetic Drift • Genetic drift describes how allele frequencies fluctuate unpredictably from one generation to the next • Bottleneck Effect= event kills a large number of individuals and only a small subset of population is left • Founder Effect= Small number of individuals colonize new location
Case Study: Impact of Genetic Drift on the Greater Prairie Chicken • Loss of prairie habitat= severe reduction in the population of greater prairie chickens in Illinois • Low levels of genetic variation, only 50% of their eggs hatched Pre-bottleneck (Illinois, 1820) Post-bottleneck (Illinois, 1993) Greater prairie chicken Range of greater prairie chicken
Case Study: Impact of Genetic Drift on the Greater Prairie Chicken • Researchers used DNA from museum specimens to compare genetic variation in the population before and after the bottleneck • Results showed a loss of alleles at several loci
Figure 23.11b Number of alleles per locus Percentage of eggs hatched Population size Location Illinois 1930–1960s 1993 5.2 3.7 1,000–25,000 <50 93 <50 Kansas, 1998 (no bottleneck) 750,000 5.8 99 Nebraska, 1998 (no bottleneck) 75,000– 200,000 5.8 96
Case Study: Impact of Genetic Drift on the Greater Prairie Chicken • Researchers introduced greater prairie chickens from population in other states • Introduced new alleles into population • Increased the egg hatch rate to 90%
Genetic Drift: Summary • Genetic drift is significant in small populations • Genetic drift causes allele frequencies to change at random • Genetic drift can lead to a loss of genetic variation within populations • Genetic drift can cause harmful alleles to become fixed
Gene Flow • Gene flow = movement of alleles among populations • Alleles can be transferred through: • Movement of fertile individuals • Gametes • Gene flow tends to reduce variation among populations over time • Barriers to dispersal can limit gene flow between populations
Geographic Variation • Most species exhibit geographic variation • Differences between gene pools of separate populations • Mice in Madeira • Island in Atlantic Ocean • Several isolated populations of non-native mice • Mountain range prevents gene flow • Fusion of chromosomes
Geographic Variation Variation among populations is due to drift, not natural selection
Geographic Variation Cline= graded change in a trait along a geographic axis Mummichog Fish and Cold-Adapted Allele Effect of natural selection
Natural Selection • Evolution by natural selection involves both change and “sorting” • New genetic variations arise by chance • Beneficial alleles are “sorted” and favored by natural selection • Only natural selection consistently results in adaptive evolution
Evolution • Evolution by natural selection is possible because of genetic variation in population • Gene pool= all the alleles for all loci in a population • Genetic Variation = differences in DNA sequences • Gene variability • Average heterozygosity= average percent of loci that are heterozygous in a population • Fixed loci= all individuals in a population have same allele • Nucleotide variability • Measured by comparing the DNA sequences of pairs of individuals
Evolution • Phenotype= product of inherited genotype + environmental influences • Discretecharacters= classified on an either-or basis • Flower color: red or white • Quantitative characters= vary along a continuum within a population • Skin color in humans • Natural selection can only act on variation with a genetic component
Evolution • Genetic variation primarily comes from 2 sources: • Mutation and Gene Duplication • Original source of new alleles or genes • May be neutral before it becomes an advantage • “raw material” of evolution • Sexual Reproduction= unique combination of genes following crossing over, independent assortment of chromosomes, and random fertilization
Evolution • Genetic drift and gene flow do not consistently lead to adaptive evolution • Can increase or decrease the match between an organism and its environment • Natural selection increases the frequencies of alleles that enhance survival and reproduction • Adaptive evolution occurs as the match between an organism and its environment increases • Because the environment can change, adaptive evolution is a continuous process
Evolution of a Population Generations • Types of Natural Selection • Directional Selection • Highest reproduction in one extreme phenotype • Stabilizing Selection • Highest reproduction of intermediate phenotypes • Disruptive Selection • Highest reproduction of two extreme phenotypes 1 2 3
Figure 23.13 Original population Frequency of individuals Phenotypes (fur color) Original population Evolved population (a) Directional selection (b) Disruptive selection (c) Stabilizing selection
Sexual Selection • Form of natural selection • Individuals with certain traits are more likely to mate • Sexual Dimorphism= differences in appearance of males and females • Vertebrates= males usually “showier” of sexes or engage in competition for females • Characteristics may be disadvantage • Male birds with bright feathers more obvious to predators
Sexual Selection • Intrasexual selection=competition among individuals of one sex (often males) for mates of the opposite sex • Intersexual selection(mate choice)= individuals of one sex (usually females) are choosy in selecting their mates
Sexual Selection • How do female preferences evolve? • Good genes hypothesis= if a trait is related to male health, both the male trait and female preference for that trait should increase in frequency
Example of Sexual Selection • Females select males based on traits indicating defenses against parasites and pathogens • Bird, Mammal, and Fish Species • Female stickleback fish and Major Histocompatibility Complex (MHC) • Higher reproductivesuccess increases frequency of defense trait in next generation
Genetic Variation in Populations • Neutral variation= genetic variation that does not confer a selective advantage or disadvantage • Various mechanisms help to preserve genetic variation in a population • Diploidy= maintains genetic variation in the form of hidden recessive alleles • Heterozygotes can carry recessive alleles that are hidden from the effects of selection
Genetic Variation in Populations • Balancing selection= natural selection maintains stable frequencies of two or more phenotypic forms in a population • Balancing selection includes • Heterozygote advantage • Frequency-dependent selection
Heterozygote Advantage • Malaria caused by protist, Plasmodium • 1-2 million people die/yr from disease • Modifies red blood cells to obtain nutrients, escape destruction by spleen
Heterozygote Advantage Normal Blood Cell • Sickle-Cell Allele: recessive allele • Produces abnormal hemoglobin proteins Sickle-Cell
Heterozygote Advantage • Homozygous Dominant • No sickle cell allele • Susceptible to malaria • Homozygous Recessive • Sickle-cell disease • Resistant to malaria • Heterozygotes= co-dominant alleles, both types of blood cells • Heterozygotes have decreased symptoms of malaria and decreased symptoms of sickle-cell disease • Higher survival
Frequency-Dependent Selection • Fitness of a phenotype declines if it becomes too common in the population • Selection can favor whichever phenotype is less common in a population • Example: Predators can form a “search image” of their prey • Most common phenotype • Rare phenotypes may avoid detection by predators, increasing survival and reproduction
Limits of Natural Selection • Selection can only act on existing variation in a population. • New alleles do not appear when needed • Evolution is limited by historical constraints. • Ancestral structures are adapted to new situations • Adaptations are usually compromises. • One characteristic may be an adaptation in one situation, a disadvantage in another • Natural selection interacts with chance/random events and the environment. • Chance events can alter allele frequencies in population • Environment can change
Evolution of Populations • Measured by calculating changes in gene pool over time • Frequency of an allele in a population • Diploid organisms: total number of alleles at a locus is the total number of individuals times 2 • Homozygous Dominant= 2 dominant alleles • Heterozygous= 1 dominant, 1 recessive allele • Homozygous Recessive= 2 recessive alleles
Frequency of Alleles in Population • For a characteristic with 2 alleles, we can use p and q to represent their frequencies • Frequency of Alleles: • p= frequency of “A” allele (dominant) • Total number of “A” alleles/total number of alleles • q= frequency of “a” allele (recessive) • Total number of “a” alleles/total number of alleles • Frequency of Alleles= p+ q =1
Frequency of Alleles in Population • Population of wildflowers that is incompletely dominant for color • 320 red flowers (CRCR) • 160 pink flowers (CRCW) • 20 white flowers (CWCW) • Calculate the number of copies of each allele: • CR (number of homozygotes for CR X 2) + number of heterozygotes • (320 2) 160 800 • CW (number of homozygotes for CW x 2) + number of heterozygotes • (20 2) 160 200
Frequency of Alleles in Population • To calculate the frequency of each allele: • p freq CR number of CR alleles/total number of alleles • p = 800 / (800 200) 0.8 • q freq CW number of CW alleles/total number of alleles • q= 200 / (800 200) 0.2 • The sum of alleles is always 1 • 0.8 0.2 1
Hardy-Weinberg Principle • The Hardy-Weinberg principle describes a population that is not evolving • frequency of alleles will not change from generation to generation • A “null hypothesis” to check for evidence of evolution • If a population does not meet the criteria of the Hardy-Weinberg principle, it can be concluded that the population is evolving
Hardy-Weinberg Principle Figure 23.7 Alleles in the population Gametes produced Frequencies of alleles p = frequency of Each egg: Each sperm: CR allele = 0.8 q = frequency of 20% chance 20% chance 80% chance 80% chance CW allele = 0.2 • In a given population where gametes contribute to the next generation randomly, allele frequencies will not change • Mendelian inheritance preserves genetic variation in a population
Hardy-Weinberg Principle • When allele frequencies remain constant from generation to generation, the population is in Hardy-Weinberg equilibrium • Assumptions: • No natural selection • No mutation • No gene flow • Random mating • Large population
Hardy-Weinberg Equilibrium • Hardy-Weinberg Equilibrium Equations • Frequency of Alleles: p + q = 1 • Frequency of Genotypes: p2 + 2pq + q2 = 1
Hardy-Weinberg Equilibrium • The variables “p” and “q” come from Punnett Square for populations • p= frequency of “A” allele (dominant) • q= frequency of “a” allele (recessive)
Hardy-Weinberg Equilibrium • Hardy-Weinberg Equilibrium Equations • Frequency of Alleles: p + q = 1 • p= 0.7 • q=0.3 • Frequency of Genotypes: p2 + 2pq + q2 = 1 • p2 = frequency of “AA” genotype • Ex: 0.72 = 0.49 • 2pq = frequency of “Aa” genotype • Ex: 2(0.7)(0.3)= 0.42 • q2 = frequency of “aa” genotype • Ex: 0.32 = 0.09 • Frequency of Genotypes= 0.49 + 0.42 + 0.09 = 1
Population Variables: Hardy-Weinberg Equilibrium • Once scientists know what p and q are in the population, they can track the population through time and see if population is at equilibrium or changing • If p and q change through time, one of the Hardy-Weinberg Equilibrium assumptions are not being met • Evolution is occurring • Populations can be at equilibrium at some loci, but not at other loci
Real-World Example: Hardy-Weinberg Equilibrium and Fisheries Management • Kelp Grouper (Epinephelus bruneus) • Commercial fish species in Korea • Recent declines in landings • 2007: IUCN Red List- Vulnerable • Study by An et al. 2012 • Genotyped 12 gene loci from 30 fish • 3 of 12 loci showed deviations from Hardy-Weinberg Equilibrium