Download
1 / 12
120 likes | 337 Views
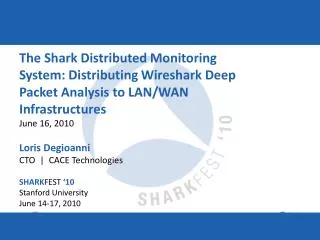
The Shark Distributed Monitoring System: Distributing Wireshark Deep Packet Analysis to LAN/WAN Infrastructures June 16, 2010 Loris Degioanni CTO | CACE Technologies SHARK FEST ‘10 Stanford University June 14-17, 2010. Quotes from the conference.

E N D
The Shark Distributed Monitoring System: Distributing Wireshark Deep Packet Analysis to LAN/WAN Infrastructures June 16, 2010 Loris Degioanni CTO | CACE Technologies SHARKFEST‘10 Stanford University June 14-17, 2010
Quotes from the conference “The fundamentals are the same, but the scale of network troubleshooting is much bigger today.” Hansang Bae, Citi “One of the main reasons why you need to capture is to get the smoking gun.” Tim Chung, Google “No matter what, any company needs to capture all its network traffic. It’s the only final proof when something goes wrong. What’s interesting is how the captured data is used.” Tim Belcher, NetWitness
Components • Probe • 24/7 packet collection • Live metrics • Watches/Alerts • Support for multiple consoles • Ajax control interface • Basic HTML interface for capture settings • Sold as • Appliance 1G/10G • Kit (1G/10G card + software) • Software only (Q4) • Console • Windows .net application • Charting • Reporting • Send to wireshark • Controller (Q4) • Centralized user and license management • Centralized way of pushing views and watches • Centralized alert/event collection and correlation • Automatic reporting • Automatic search for specific IPs/ports/… across multiple probes
Appliances • 4 TB Storage • 1 Gbps sustained to disk • 8 TB Storage • 3 Gbps sustained to disk • 16 TB Storage • 7 Gbps sustained to disk
Announcing 10 Gbit Appliances and Kit • Full rate Capture and analysis • 7+ Gbps sustained to disk
Collection: Capture jobs • Capture and rotate the packets coming from the network • Uses a dedicated file system on the RAID array • Can run multiple capture ports at the same time. • E.g. Different capture ports • A single capture job can capture from multiple ports
Now what? I can capture a lot of packets. Now what?
Indexing • Writing packets uses a lot of the disk bandwidth • Even if I stop capturing, since I was writing at full speed, reading the data is going to take around the same time of writing it • Read needs to be localized • I need high level visibility to reach the point I need
Indexing • Happens while capturing, you can enable it when you create a capture job • Contains summary of the network traffic • Volume, talkers and protocol information • “Netflow on steroids” • Designed to be extremely efficient in terms of disk usage • Coordinated with the packet store