Download
1 / 1
10 likes | 128 Views
Changes in kidney volume in experimental Polycystic Kidney Disease (PKD) quantified by a clinical 3T MR Scanner. Sheryl L. Foster 1 , Mayuresh S. Korgaonkar 2 , Gopi K. Rangan 3 , Kristina G. Schwensen 3 and Anthony Peduto 1

E N D
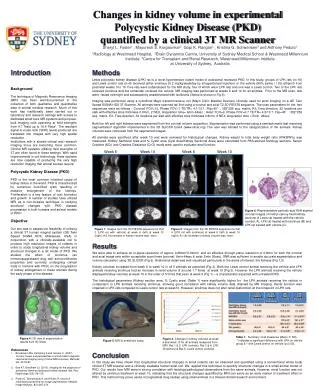
Changes in kidney volume in experimental Polycystic Kidney Disease (PKD) quantified by a clinical 3T MR Scanner Sheryl L. Foster1 , Mayuresh S. Korgaonkar2, Gopi K. Rangan3 , Kristina G. Schwensen3 and Anthony Peduto1 1Radiology at Westmead Hospital, 2Brain Dynamics Centre, University of Sydney Medical School & Westmead Millennium Institute, 3Centre for Transplant and Renal Research, Westmead Millennium Institute at University of Sydney, Australia Introduction Methods Lewis polycystic kidney disease (LPK) rat is a novel hypertensive rodent model of autosomal recessive PKD. In this study, groups of LPK rats (n=18) and Lewis control rats (n=8) received either sirolimus (0.2 mg/kg/weekday by intraperitoneal injection) or the vehicle (90% saline / 10% ethanol) from postnatal weeks 3 to 10. Five rats were subanalysed for the MR study, four of which were LPK rats and one was a Lewis control. Two of the LPK rats received sirolimus and the remainder received the vehicle. MR imaging was performed at weeks 6 and 10 for all animals. Prior to the MR scan, rats were fasted overnight and subsequently anaesthetized with isoflurane (Setup is shown in Fig.5). Imaging was performed using a cylindrical Mayo transmit/receive coil (Mayo Clinic Medical Devices) clinically used for wrist imaging on a GE Twin Speed SIGNA HDX 3T Scanner. All animals were scanned tail first using a coronal and axial T2 3D FIESTA sequence. The scan parameters for the two sequences were as follows - Coronal: FOV=10, Phase FOV=1 TE/TR= 4.1/12.1, Flip=45°, 352*256 acq. matrix, R/L Freq direction, 32 locations per slab with effective slice thickness 0.8mm, 2 NEX, Acquisition time= 6min 44sec ; Axial: FOV=9, Phase FOV=0.7 TE/TR= 4.3/13.7, Flip=45°, 352*256 acq. matrix, R/L Freq direction, 32 locations per slab with effective slice thickness 0.8mm, 2 NEX, Acquisition time = 5min 26sec. Both the left and right kidneys were segmented from the coronal volume acquisition. Segmentation was performed using a semiautomatic fast marching segmentation3 algorithm implemented in the 3D SLICER toolkit (www.slicer.org) The user was blinded to the categorization of the animals. Kidney volumes were computed from the segmented images. All animals were sacrificed after week 10 and were reviewed for histological changes. Kidney weight to total body weight ratio (KW:BW%) was measured. Kidney Sectional Area and % Cystic area (Cyst Area/Kidney Sectional Area) were calculated from PAS-stained histology sections. Serum Creatine (SCr) and Creatine Clearance (CrCl) levels were used to evaluate renal function. Background The technique of Magnetic Resonance Imaging (MRI) has been well-documented in the collection of both qualitative and quantitative data in animal medical research. Much of this work has traditionally been carried out in laboratory and research settings with access to dedicated small bore MR systems and purpose-built imaging coils operating at field strengths from 4.7 Tesla up to 16.4 Tesla1. The resultant signal-to-noise ratio (SNR) levels produced are translated into images with very high spatial resolution. Institutions with a shared clinical and research imaging focus are becoming more common. Clinical MR systems utilising field strengths of 3T are often found in these settings. With rapid improvements in coil technology, these systems are now capable of producing the very high resolution imaging that animal studies require. Polycystic Kidney Disease (PKD) PKD is the most common inherited cause of kidney failure in the world. PKD is characterized by numerous fluid-filled cysts resulting in massive enlargement of the kidneys. Proliferation is a key feature of cyst formation and growth. A number of studies have utilized MRI as a non-invasive technique in studying structural changes with PKD disease progression in both humans and animal models of PKD2. Objective Our aim was to assess the feasibility of utilising a clinical 3T human magnet system (GE Twin Speed SIGNA HDX, Milwaukee, USA) in conjunction with a clinically-available coil to produce high resolution images of rodents in order to study longitudinal kidney volume and structural changes in a rat model of PKD. We studied the effect of sirolimus (an immunosuppressant drug with anti-proliferative properties and currently undergoing clinical trials in humans with PKD) on the progression of kidney enlargement in these animals during the early phase of the disease. Week 6 Week 10 Week 6 Week 10 Figure 4: 3D view of segmentation results from 3D Slicer Figure 1: Images from the 3D FIESTA sequence for Rat 2 (LPK rat with vehicle) at week 6 (left) & week 10 (right). A 5.4x increase in kidney volume was seen. Figure 2: Images from the 3D FIESTA sequence for Rat 4 (LPK rat with sirolimus) at week 6 (left) & week 10 (right). A 1.8x increase in kidney volume was seen. Results We were able to achieve an in-plane resolution of approx 0.28mm*0.39mm and an effective through-plane resolution of 0.8mm for both the coronal and axial image sets within acceptable scan times (coronal: 6min 44sec & axial: 5min 26sec). SNR was sufficient to enable accurate segmentation and volume calculation using 3D SLICER (Fig 5). Anatomical detail was well-visualized particularly in the areas of interest, the kidneys (Fig 1,2). Kidney volumes increased from week 6 to week 10 in all 5 animals as expected (Fig 3). Both the Lewis control animal receiving the vehicle and LPK animals receiving sirolimus had an increase in renal volume of around 1.7 times at week 10 (Fig 3). However the LPK animals receiving the vehicle displayed kidney volumes at week 10 in the order of 5 times that seen at week 6 (Fig 1) – a characteristic expected with untreated PKD. The histological parameters (Kidney section area, % Cystic area) (Table 1) were significantly higher for the LPK animals receiving the vehicle in comparison to LPK animals receiving sirolimus, showing good correlation with kidney volume data attained by MR imaging. Renal function was impaired in LPK rats compared to Lewis control rats at week10. However, sirolimus does not alter renal dysfunction at this timepoint in LPK rats. C B A Table 1: Summary of all measures (Mean ± SD). * indicates a significant difference with LPK on vehicle group & ^ with Lewis control on vehicle (p<0.05). Figure 6: Representative periodic-acid Shiff stained coronal images of methyl-carnoy-fixed kidney sections of Lewis rat treated with the vehicle (control, A), LPK rat treated with sirolimus (B) and LPK rat treated with vehicle (C). Figure 5: MRI & anesthetic setup Figure 3: Changes in kidney volumes at week 6 and week 10 for all animals measured from MRI. Rat 1 & 2: LPK (vehicle); Rat 3 & 4: LPK (Sirolimus) & Rat 5: Lewis control (vehicle). • References • Brockmann MA, Kemmling A and Groden C. (2007). Current Issues and perspectives in small rodent magnetic resonance imaging using Clinical MRI scanners. Methods, Vol. 43:79-87. • Bae KT, Grantham JJ. (2010). Imaging for the prognosis of autosomal dominant polycystic kidney disease. Nat. Rev. Nephrology, 6(2): 96-106. • Picton E, Tannenbaum A. and Kikinis R. (2004) A statistically based flow for image segmentation. Medical Image Analysis, 8(3):267-274, Conclusion In this study we have shown that longitudinal structural changes in small rodents can be observed and quantified using a conventional whole body clinical 3T MR scanner and a clinically available human wrist coil. We applied this technique to quantify structural changes in a small animal model of PKD. Our results from MRI were in strong correlation with histology/pathological observations from the same animals. However, renal function was not altered by sirolimus treatment at week 10, indicating that the structural changes quantified by MRI can serve as an early marker of treatment effect in PKD. This method may prove useful in longitudinal drug studies using small animals in a shared clinical/research environment.