
Graphing Exponential Functions
E N D
Presentation Transcript
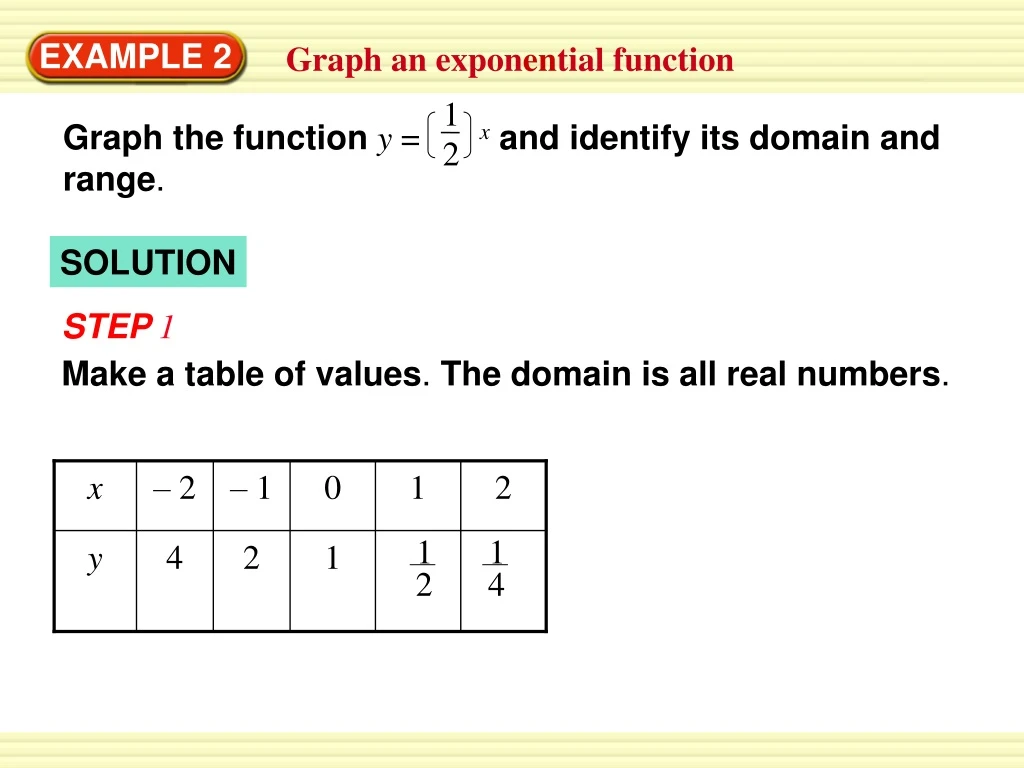
Graph the function y = xand identify its domain and range. 1 2 x – 2 – 1 0 1 2 1 1 y 4 2 1 2 4 EXAMPLE 2 Graph an exponential function SOLUTION STEP1 Make a table of values. The domain is all real numbers.
EXAMPLE 2 Graph an exponential function STEP 2 Plot the points. STEP 3 Draw a smooth curve through the points. From either the table or the graph, you can see the range is all positive real numbers.
1 1 1 1 2 3 2 2 EXAMPLE 3 Compare graphs of exponential functions x x Graph the functionsy = 3 andy= − Compare each graph with the graph ofy= x
1 1 4 2 1 2 3 3 6 3 1 1 1 – x y =∙x y =3 ∙ y =x x 3 2 2 – –2 12 4 –1 2 6 – 1 12 0 1 – 3 3 1 1 – 2 2 3 1 2 – 4 4 Compare graphs of exponential functions EXAMPLE 3 SOLUTION
1 1 1 1 1 1 1 1 1 1 1 2 2 2 2 2 3 3 2 2 3 2 – EXAMPLE 3 Compare graphs of exponential functions Because the y-values for y =3 xare 3 times the corresponding y-values for y = x, the graph of y = 3 xis a vertical stretch of the graph of y = x. Because they-values for y =xare times the corresponding y-values for y = x, the graph of y = xis a vertical shrink with reflection in the x-axis of the graph of y = x. – –
2. Graph the function y = (0.4)xand identify its domain and range. ANSWER Domain: all real numbers Range: all positive real numbers for Examples 2 and 3 GUIDED PRACTICE
Graph the functionsy = 5 (0.4)x.Compare graph with the graph ofy=(0.4)x. 3. ANSWER The graph is a vertical stretch ofy = (0.4)x. for Examples 2 and 3 GUIDED PRACTICE