Download
1 / 28
280 likes | 300 Views
Explore new methods and statistical analysis for understanding brain dynamics in event-related scenarios. Discover pitfalls of current methods and future directions in neuroscience research.

E N D
Being Comoplex is Simpler: Event Related Dynamics Pedro Valdes-Sosa Eduardo Martínez-Montes Cuban Neurosciences Centre Wael El-Deredy School of Psychological Sciences
Outline • Different event-related scenarios • From time to time-frequency • Examples of pitfalls of current methods • New methods based on complex statistics • Where do we go next?
Makeig et al, Science 2002 How did we get here?
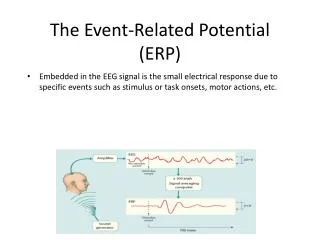
Event-related scenarios • Event-Related Potential (ERP) • ERBD = ongoing EEG + Additive ERP; • AVG [ + ] = • ERBD = PPR (ongoing EEG); Partial Phase Resetting • AVG [ ] = • Induced Activity: Event-related synchronization and desynchronization (ERS/ERD)
0 0 500 500 1000 1000 ms Hz µV2 µV Time (ms) From time to time-frequency A measure of the distribution of the energy of the signal in time and frequency: STFT, Morlet Wavelet, Hilbert, Gabor, etc Complex coefficients , whose moduli is a measure of the amplitude of the oscillations and whose argument is a measure of their phases.
From time to time-frequency Net vector Imag Net Phase Real Each point is a complex wavelet coefficient of a trial at a given frequency and time All trials at a certain t & f form a complex cloud
From time to time-frequency Event-related scenarios Change in the position of the cloud mean vector Change in the shape of the cloud Eigen structure Change in the dispersion of the cloud variance Current measures confound changes
Intertrial Phase Coherence Example confound: Mean vector & Phase ITC measures the uniformity of the distribution of angles, wrt the origin - not wrt the centre of the cloud
Example confound: Mean vector & Phase Removing Mean Activity Therefore, ITC (and its variants) are NOT a valid tests for inter-trial phase organisation
Net vector Imag Imag Variance Real Real Tests on the complex cloud Complex statistics on the features of the cloud (SEPARATELY): mean vector;variance; form
Imag Imag Real Real For additive ERP: It has to survive a T-test on the mean (compared to pre-stim) • For PPR: It has to survive the subtraction of the mean vector. • Significant test wrt pre-stim Tests on the complex cloud Necessary conditions
Tests on the complex cloud Proposed tests • T-complex mean (test for additive activity) L
Tests on the complex cloud Proposed tests L • T-complex variance (test for induced activity) L T-complex mean (test for additive activity)
The eigen values of the covariance matrix (2 x L) L Mardia, Kent and Bibby Multivariate analysis, 1979. Tests on the complex cloud Proposed tests • T-Eigenvalue (test for phase similarity) • Generalised correlation
L Tests on the complex cloud Proposed tests • T-Eigen value (test for phase similarity - bimodal) • Second trigonometric moment Mardia, Statistics of Directional Data, 1972.
Testing the tests: Simulations • ERP • PPR
Testing the tests • ERP • PPR
Testing the tests • Real Data Visual spatial attention. POz
Summary • Current measures (e.g. ITC) cannot distinguish between additive activity and phase resetting. • Statistical tests based on the complex time-frequency are more sensitive to changes event-related brain dynamics. • Separate tests for separate features, to avoid confounds. • Purely descriptive: No mechanistic interpretation.
What happens next? • New tests based on comparing models fitted to data. • Neural mass models • Non-parametric time series modeling
SW linear AR Original LIN-Surr
SW Kernel-AR Original Kernel-NFR