Download
1 / 13
130 likes | 269 Views
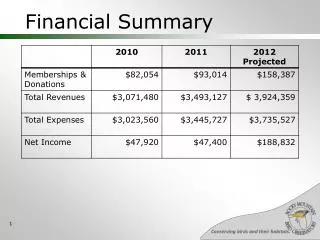
Financial Summary September 30, 2014. Bob Baden Chief Financial Officer. Statistical Summary September 30, 2014. Curr YTD Budget Average Daily Census 25.7 24.6 24.3 Occupancy % 43% 41% 41% Discharges 215 203 203

E N D
Financial SummarySeptember 30, 2014 Bob Baden Chief Financial Officer
Statistical SummarySeptember 30, 2014 CurrYTDBudget • Average Daily Census 25.7 24.6 24.3 • Occupancy % 43% 41% 41% • Discharges 215 203 203 • ALOS (MC/Total) 4.5/3.6 4.7/3.7 4.6/3.6 • CCC Avg Daily Census 105 104 103 • # Surgeries 193 192 208 • # Endoscopies 178 149 166 • # Deliveries 38 42 36 • # ER Visits 2,053 1,855 1,888 • # Outpatient Visits 3,955 3,820 3,780
Balance Sheet Pre-Audit September 30, 2014 ASSETS CurrentPreviousChange Current Assets $ 44,199,505 $40,498,879 $ 3,700,626 Assets whose use is limited $ 4,725,143 $ 4,796,864 $ (71,721) Net property value $103,701,058$103,880,777$ (179,719) Total Assets $152,625,706 $149,176,520 $ 3,449,186
Balance SheetPre-Audit September 30, 2014 Liabilities & Fund Balances CurrentPreviousChange Current liabilities $ 18,512,119 $ 15,013,405 $ 3,498,714 Long term liabilities $ 98,821,682 $ 98,215,647 $ 606,035 Fund balances $ 35,291,905$ 35,947,468$ (655,563) Total liabilities & fund bal $ 152,625,706 $149,176,520 $ 3,449,186
Summary September 2014 In September Inpatient Discharges at 215 increased by 11 compared to August and exceeded budget by 6%. Inpatient Average Daily Census increased in September to 25.7, or 11% and was 6% above budget. ALOS in September was right on budget with Medicare at 4.5 days and total at 3.6 days. Outpatient activity at 3,955 visits was 5% above budget. The CCC average daily census at 105 exceeded budget by 2% for the month. Surgery cases at 193 were 7% below budget. Endoscopy procedures at 178 were 7% over budget. Newborn deliveries at 38 in September were 6% above budget. ER visits totaled 2,053 (165 visits or 9% above budget). August Pre-Audit Acute Financials report Gross Revenue at $10.9M, which was above budget by $1.557M or 16.6%. Inpatient Gross Revenue was $278K above budget and Outpatient Gross Revenue was nearly $1.3M above budget. The budget numbers reflect the revised FY’15 to increase M’Cal volume. Contractual Discounts in September approached $1.5M over budget due to the need to book additional Bad Debt Provision, a less profitable mix on Ins & Contracts reimbursement, and M’Cal OP deductions exceeded budget by $905K.
Summary September 2014 • Net Patient Revenue at $4.3M exceeded budget by $85K and Total Operating Revenue fell short of budget by $27K (HIT funding for FY’15 is in the Budget and no funds received yet). • Total Operating Expenses of $4.58M in September were above budget by 4% or $196K. Total Salary costs exceeded budget by $156K or 9%, with Nursing over by $130K, $22K in Imaging and $17K in IS. Registry Costs were over $30K, in MS $9K, ER $4K & OR $22K. Consulting & Mgt costs were over budget by $11K due to consultant fees on the 1206b/d and consulting on employee benefits. Supply costs were over 12%, due to a $6K overage on implants, $7K sutures, $31k pharmaceuticals, $13K OR Medical Supplies and $9K on instruments. Purchased Services was over by $70K due to collections fees $16K, IS $15K, 340B Program Set up fees $10K as well as repairs & maintenance adding $21K to the cost overage. Other expenses were under budget by $18K. • The Operating Margin loss for September was $(192K) due to higher deductions and higher operating costs. A GASB rule necessitated booking of the Cost of Issuance and Underwriter’s Fees on the 2014 GO Bonds which we were not faced with when we refinanced the 2006 GO Bonds in 2013. This entry added $571K to our non-operating expenses, which left us with a bottom line loss of $(729) in September. These costs used to be recognized by writing them off over the life of the bonds. • The CCC Gross Revenues of $1.235M were $5K more than budget in September. Deductions of $32K ($12K less than budget) pushed the Net Patient Revenue to just over $1.2M or $17K above budget. Operating Expenses exceeded budget by $59K. Salary costs were $14K or 2% over budget in Nursing. Consulting & Mgt costs were $8K over budget due to allocations from the Acute.
Summary September 2014 The Operating Margin and net gain at the Bottom Line was a positive $115K for the month and $351K year-to-date. • The Champion Center booked about $42K in operating/start up costs in September, which was 46% below budget. Purchased Services were over budget by about $9K due to security service costs. The budget began increasing in September and will continue at plateaus based on predicted activity throughout the remainder of FY’15. • The Consolidated Operating Margin results posted a $(119K) loss at the operating margin and a loss of $(655K) at the Increase (decrease) in Net Assets line in September. Year-to-date numbers were $308K and $(137K) respectively. • Total Assets and Liabilities and Fund Balance increased by $3.4M as of September 30, 2014. • Total Current Assets increased by $3.7M primarily due to recognizing a $4,000,000 Accounts Receivable for the $4.0M send to the state for the FY’13 IGT. Also impacted was a drop in Cash of $358K for the $800K State fees for the IGT. Assets whose use is limited as a group declined by $71K due to use of some capital campaign funds for hospital to pay down debt on Notes Payable for the Hospital. Total Net Property, Plant and Equipment increased by $346K due to an increase in CIP of $346K for the CDRH project ($300K), $28K for the Kitchen at the CDRH and misc other CIP. $526K was the increase in depreciation. • Total Current Liabilities increased by $3.5M due primarily to recognition of the short term payable to the bank of $4.0M, offset by other accrual and payable amounts as of 9/30/14. The increase in Total Liabilities $606K is due to booking the 2014 GO Bond refinance $535K Premium and $165K principal increase. • The fund balance decreased by $655K due to the consolidated decrease in net assets recorded for September 2014.
Other Finance ItemsAugust 2014 Other Finance Items: • The Revised FY’15 Operating Budget reflecting the growth in Medi’Cal business due to expansion of M’Cal in CA is on the FC agenda for approval. • The off-site MRI is not in use and a request for declaring it surplus property is being made to allow us to sell it. • The Medi’Cal IGT for FY’13 thru CenCal Health was funded by the State in October resulting in the LVMC netting a gain of $3,078,129.54. • LVMC has just reached agreement with United Healthcare on rates for a new agreement going forward for two years. Contract language is now being worked on. • We continue to await licenses from the State on the Champion Center so we begin negotiations with health plans for services to their members. • There were no Medicare RAC take backs in September and LVMC has determined through analysis to accept the RAC Settlement on appeals which we estimate will return about $165,000 to the District of earlier RAC recoveries. • TCA Partners will begin the FY’14 Audit on October 22 and will present the audit report in November. • California reports that total Medi-Cal and CHIP enrollment increased by 19% between July 2013 and 2014.