Download
1 / 33
360 likes | 524 Views
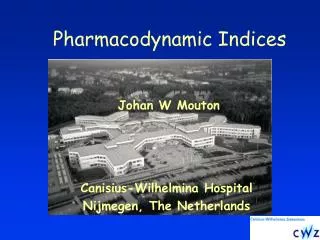
Pharmacodynamic Indices. Johan W Mouton. Canisius-Wilhelmina Hospital Nijmegen, The Netherlands. PEAK / MIC AUC / MIC TIME > MIC. PEAK. AUC. MIC. TIME > MIC. PK/PD. Neutropenic mouse thigh model Various doses and dosing regimens (q1 to q24) Outcome parameter: cfu counts after 24 h

E N D
Pharmacodynamic Indices Johan W Mouton Canisius-Wilhelmina Hospital Nijmegen, The Netherlands
PEAK / MIC AUC / MIC TIME > MIC PEAK AUC MIC TIME > MIC
PK/PD • Neutropenic mouse thigh model • Various doses and dosing regimens (q1 to q24) • Outcome parameter: cfu counts after 24 h • Plot PD index (AUC, Peak T>MIC) to effect
For K.pneumoniae, there is no clear relation between total daily dose of imipenem and efficacy in an in vivo model of infection
For beta-lactams, there is a direct relation between Time > MIC and efficacy
Pharmacodynamic Indicespredictive for efficacy T>MIC AUC (Peak)/MIC Penicillins Aminoglycosides Cephalosporins Fluoroquinolones Carbapenems Metronidazole Monobactams Daptomycin Tribactams Ketolides Clindamycin Macrolides Oxazolidinones Azithromycin Clindamycin Streptogramins Glycopeptides Glycylcyclines Tetracyclines
Antibiotics showing increasing effect (killing) over a wide range of concentrations are called ‘concentration dependent’. In vivo effects are usually AUC and/or Peak related. • Those with a limited range of increasing effect are called (wrongly) ‘concentration-independent’. In vivo effects are usually Time >MIC related.
Pharmacokinetic parameter MIC Pharmacodynamic index
MIC The MIC is a result of : • kill over time (kill rate) by the antibiotic • growth over time (growth rate) • for a certain number of micro-organisms (the inoculum) AT STATIC CONCENTRATIONS
Growth and/or kill rate dependent : • strain, species • medium composition, brand • MH, supplements, ISO • number of bacteria • inoculum • 5.105 (NCCLS) vs 105 (BSAC) • temperature (35o vs 37o) • growth phase • CO2 • etc.
The MIC of the control strain should be within one two-fold dilution of the expected MIC
PHARMACOKINETIC parameters
Definition :The Area under the Concentration-time curve over 24 hours. Note: ….. It should be stated how the AUC is determined : based on (log) linear trapezoideal rule, based on clearance, or based on microconstants. Dimensions : concentration x time e.g. mg.h/L or g.h/mL Mouton et al, Int J Antimicrob Agents april 2002
AUC 0-24 = 3033 AUC inf = 5100 AUC 0-24 sd = 1361 AUC inf sd =1700 Mg.h/L
WHICH AUC? • AUC 0-24h or AUC • Steady State? • (log) trapezodeal rule? • Derived ? (A/ +B/ or other)
Peak/MIC Definition : the peak level divided by the MIC. Dimensions : no dimensions. Mouton et al, Int J Antimicrob Agents april 2002
WHICH PEAKLEVEL? • After the 1st, 2nd or later dose? • If more than one compartment, the peak level in compartment 1, 2 or even 3?
Time > MIC Definition : the % of time above the MIC over a period of 24 hours. Note : if the period is other than 24 h, this should be stated explicitly. Dimensions : %. Mouton et al, Int J Antimicrob Agents april 2002
Concentration-time profile of beta-lactam Vd = 20 L, Ka = 1.2 h-1, Ke = 0.3 h-1
Monte Carlo Simulation of beta-lactam Vd = 20 L, Ka = 1.2 h-1, Ke = 0.3 h-1, VC=20% 4h 10h Mouton, Int J Antimicrob Agents april 2002
Amoxicillin/clavulanic acid Mouton & Punt, JAC 2001
For all indices : how are they determined how are they calculated what is the error?