Download
1 / 32
320 likes | 454 Views
BRACE IMPACT Evaluation: Phase II baseline. Findings from Upper Nile and Western Bahr el Ghazal States Juba, 31 October 2013 www.southsudan-braceproject.org. WHAT is BRACE?. “Building Resilience through Asset Creation and Enhancement” (BRACE) – 2012 until 2015

E N D
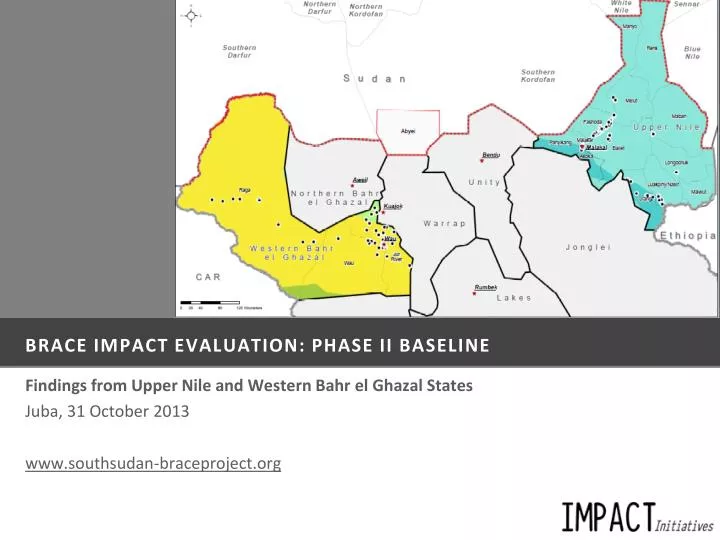
BRACE IMPACT Evaluation: Phase II baseline Findings from Upper Nile and Western Bahr el Ghazal States Juba, 31 October 2013 www.southsudan-braceproject.org
WHAT is BRACE? • “Building Resilience through Asset Creation and Enhancement” (BRACE) – 2012 until 2015 • Food and cash transfers to households • Builds skills, physical assets and knowledge • To strengthen household and community resilience. • FFA: ‘Food For Assets’ in 3 states – Northern Bahr el Ghazal & Warrap State (Phase I), & Western Bahr el Ghazal (Phase II) • Funded by: • Implemented by: • Through: Local Partners • WHAT is BRACE Impact Evaluation? • An Impact Evaluation of BRACE FFA activities using two complementary methodologies: • Household Economic Analysis (HEA) methodology • Focus Group Discussions • Quasi-experimental methodology • Household interviews • Community discussions • Funded by: • Implemented by: What is ...
Ironstone Plateau livelihood zone Livelihood zone – Ironstone plateau
Eastern Flood Plains livelihood zone • Nile and Sobat Rivers livelihood zone Livelihood zones – Eastern Flood Plains and Nile & Sobat Rivers
Interview locations – by FSMS county-level food insecurity rating
Food Insecurity Rating – developed by WFPs Food Security Monitoring System (FSMS) Food insecurity rating calculation
Sample by household level food insecurity , wealth group and FFA participation/eligibility • Sample by Livelihood Zone The sample
Food insecurity – state, wealth, county and prior FFA/GFD participation
FINDINGS • Higher proportion of food insecure households in the Eastern Flood Plains LZ (50%) compared to Nile and Sobat Rivers (32%) and Ironstone Plateau (38%) • No significant difference in proportion of food insecurity when comparing states – 39% in Western Bahr el Ghazal and 40% in Upper Nile • Similar to FSMS data (Round 10, June 2013): 39% of households in Western Bahr el Ghazal and 38% of households in Upper Nile were found to be food insecure. • Higher proportion of severelyfood insecure households in Western Bahr el Ghazal (10%) compared to Upper Nile (3%). Food insecurity – by livelihood zone
FINDINGS • Recall that highest proportion of food insecure households was found in the Eastern Flood Plains livelihood zone in Upper Nile • On the Eastern Flood Plains, the Very Poor were much more likely to be food insecure (67%) than Middle/Better-off households (13%) • Same in Nile and Sobat River – 34% of Very Poor households were food insecure, compared to 19% of Middle/Better-off • Trend reversed in Western Bahr el Ghazal – Very Poor were less likely to be categorised as food insecure (32%) compared to Middle/Better-off (47%). Food insecurity – by wealth group and livelihood zone
FINDINGS • Upper Nile: Longochuk County highest proportion of food insecure households (72%) • Western Bahr el Ghazal: Jur River County highest proportion food insecure households (65%) Food insecurity – by county
FINDINGS • Baseline data collection included communities selected for BRACE FFA participation (treatment) and those that were not selected (control) in Upper Nile – and selection from all bomas in Western Bahr el Ghazal (all eligible for FFA selection) • Some households had already participated in FFA, either through BRACE in Upper Nile or through previous interventions in Western Bahr el Ghazal • Based on baseline data households were split into four groups – those that had 1) already participated in FFA; 2) switched from FFA to GFD; 3) participated in GFD; 4) not participated in any intervention • Aim of the impact evaluation is to assess difference in change of food security and resilience status of households, depending on these four ‘starting points.’ • FFA participation was actually higher in Western Bahr el Ghazal where 23% of households had participated in FFA during the 12 months preceding the survey compared to 10% in Upper Nile. • In Upper Nile, 39% of households at FFA locations had participated in FFA and the vast majority of households at non-FFA locations (96%) had not participated in any intervention at all - just 4% had participated in GFD. Prior FFA/GFD participation – by location and State
FINDINGS • In Upper Nile: Very Poor households were the least likely to have participated in any intervention – 42% had taken part compared to 55% of Poor and 54% of Middle/better-off households. • Trend reversed in Western Bahr el Ghazal: Poorer households were more likely to have participated in FFA and/or GFD – 37% of Very Poor households had participated compared to 30% of Middle/better-off households. Future rounds of surveying will aim to establish whether FFA participation is associated with an increase in wealth or whether wealthier households are more likely to participate in FFA. Prior FFA/GFD participation – by wealth group, location and state
FINDINGS • In Western Bahr el Ghazal: more food insecure households amongst those that had not yet participated in FFA (39%) compared to those that had (35%). • But smaller proportion were severely food insecure (8%) compared to FFA households (14%). • In Upper Nile: no difference in food security comparing FFA and Non-FFA locations in same LZ Further rounds of surveying will attempt to identify whether the variation is attributable to FFA participation, or whether other factors drive this difference. Food insecurity – prior FFA/GFD participation
FINDINGS • Majority of household members aged less than 15 years (54%) – higher than the proportion reported by the latest census (44.4%). • Almost a quarter (24%) of household members were aged less than 5 – also higher than the 2008 census (16%). • Average age-dependency ratio was the same for households at FFA and Non-FFA locations in Upper Nile (1.9) – was higher in Western Bahr el Ghazal (2.2). • Average household size higher in Upper Nile (8.3) where 31% of households contained 10 or more members, compared to Western Bahr el Ghazal (6.9), where 17% of households had 10 or more members. • In Upper Nile: more than a third (37%) of households in Nile and Sobat Rivers contained 10 or more members, compared to 22% in the Eastern Flood Plains. Demographics – age and household size
FINDINGS • Larger households were more likely to be food secure, across all livelihood zones. • Hence 66% of households with 10 or members in Eastern Flood Plains; 77% in Nile and Sobat Rivers; and 78% in Ironstone Plateau livelihood zones were found to be food secure. • The corresponding figure amongst households with 1-6 members was just 46% on the Eastern Flood Plains; 57% in Nile and Sobat Rivers; and 56% on the Ironstone Plateau. Demographics – food insecurity by household size and livelihood zone
FINDINGS • This effect remained when controlling for wealth amongst poorer households – larger households were more likely to be food secure when compared to smaller households in the same Poor or Very Poor wealth group Demographics – food insecurity by household size, wealth group and livelihood zone
FINDINGS • Households identifying themselves as female headed were more likely to be poorer – 77% of female headed households were Very Poor (77%) compared to 69% of male headed households • This effect remained when controlling for livelihood zone – the most marked difference is on the Ironstone Plateau, where 76% of female headed households were Very Poor, compared to 63% of male headed households. • Households identifying themselves as female headed were actually more likely to be food secure (62%) compared to male headed households (60%). This trend remained when comparing households within the same livelihood zones. Demographics – wealth group by gender of household head and livelihood zone
FINDINGS • Overall, IDP households were most likely to be food insecure (60%), followed by hosts (49%), migrants (35%) and returnees (32%). • This effect remained when comparing households in Western Bahr el Ghazal – while 63% of IDP households were found to be food insecure in Western Bahr el Ghazal, the corresponding proportion amongst Host households was 36%, followed by Migrants (32%) and Returnees (25%). • The effect did not remain when comparing households in Upper Nile. Demographics – food insecurity by residence status of household head and state
FINDINGS • Food security amongst the six tribes that the majority of households were affiliated to. • In Upper Nile, Shilluk households were most likely to be food insecure (45%) followed by Nuer Gajiok (42%), other tribes (31%) and Dinka Dhongjol 23%). • In Western Bahr el Ghazal, Luo (Jur) households were found most likely to be food secure (58%) followed by Dinka Rek (45%), Balanda (24%) and other tribes (24%). Demographics – Food insecurity by tribal affiliation and State
THE MODEL • To explore the relative effect of demographic factors on household level food security, a linear regression model was fitted for Food Insecurity Rating as a response variable where: • Severely Food Insecure = 0 • Moderately Food Insecure = 1 • Food Secure = 2 • Variables that were indicated as statistically insignificant were removed stepwise from the model until all variables were statistically significant at 5% level (p<0.05). • VARIABLES • Response variable: Food insecurity • Explanatory variables: • Wealth group • High food insecurity counties • Prior FFA/GFD participation • Household size • Proportion of members aged less than 15 • Kinship ties • Female household headship • Residency status • Tribal affiliation Food insecurity – linear regression
Linear regression model – Food insecurity Food Insecurity – linear regression
Linear regression model - Findings • Belonging to the Middle/better-off wealth group was associated with a 11.5% increase in food security bracket compared to the poorer wealth groups. • Living in Longochuk County was associated with a 78.5% decrease and in Jur River County with a 69.9% decrease in food security bracket, compared to other counties • Each additional household member was associated with a 1.8% increase in food security bracket. • Each additional five households that a household was related to by kinship were associated with a 4.2% increase in food security bracket. • Having an IDP household head was associated with a 25.3% decrease in food security bracket and a returnee household head with a 10% increase, compared to other households. • Nuer Gajiok tribal affiliation was associated with a 31.7% decrease in food security bracket and Shilluk tribal affiliation with a 19.2% decrease compared to other tribes. • Variation when comparing the Poor and Very Poor wealth groups; FFA, GFD and no participation; female and male headship; migrant and host residency status; Dinka Rek, Dinka Dhongjol, Balanda and Luo and other tribal affiliations, was not statistically significant once controlling for the variables above. Food insecurity – linear regression
Thank you! • The full dry season baseline report for Western Bahr el Ghazal and Upper Nile states will be released shortly – here we will explore food insecurity factors in detail, looking at food consumption, food sources, expenditures, income sources, coping strategies and other resilience indicators including health, water and sanitation. • All reports, primary and secondary data and mapping for the BRACE project can be found at: www.southsudan-braceproject.org • For further information and comments please do not hesitate to get in touch: elisabeth.vikman@acted.org Thank you!