Download
1 / 1
10 likes | 109 Views
Explore robust Python scripts for genetic marker analysis, grouping, and map construction. Validate genetic maps with a suite of quality control tools.

E N D
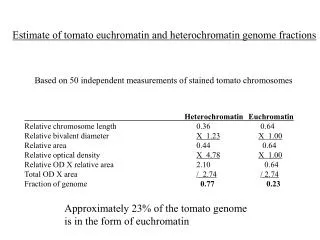
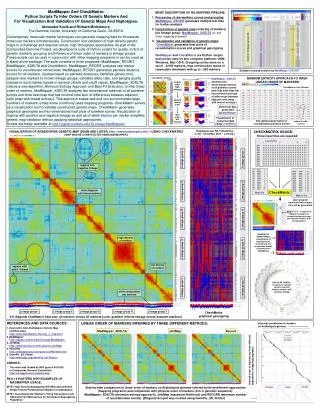
MadMapper_XDELTA JoinMap Record MadMapper And CheckMatrix: Python Scripts To Infer Orders Of Genetic Markers And For Visualization And Validation Of Genetic Maps And Haplotypes. Alexander Kozik and Richard Michelmore. The Genome Center, University of California Davis, CA 95616. Contemporary molecular marker techniques can generate mapping data for thousands molecular markers simultaneously. Construction and validation of high density genetic maps is a challenge and requires robust, high-throughput approaches. As part of the Compositae Genome Project, we developed a suite of Python scripts for quality control of genetic markers, grouping and inference of linear order of markers in linkage groups. These scripts can be used in conjunction with other mapping programs or can be used as a stand-alone package. The suite consists of three programs: MadMapper_RECBIT, MadMapper_XDELTA and CheckMatrix. MadMapper_RECBIT analyses raw marker scores for recombinant inbred lines. MadMapper_RECBIT generates pairwise distance scores for all markers, clusters based on pairwise distances, identifies genetic bins, assigns new markers to known linkage groups, validates allele calls, and assigns quality classes to each marker based on several criteria and cutoff values. MadMapper_XDELTA utilizes a new algorithm, Minimum Entropy Approach and Best-Fit Extension, to infer linear order of markers. MadMapper_XDELTA analyzes two-dimensional matrices of all pairwise scores and finds best map that has minimal total sum of differences between adjacent cells (map with lowest entropy). This approach scales well and can accommodate large numbers of markers, unlike some commonly used mapping programs. CheckMatrix serves as a visualization tool to validate constructed genetic maps. CheckMatrix generates graphical genotypes and two-dimensional heat plots of pairwise scores. Visualization of regions with positive and negative linkage as well as of allele fraction per marker simplifies genetic map validation without applying statistical approaches. Scripts are freely available at http://cgpdb.ucdavis.edu/XLinkage/MadMapper/ BRIEF DESCRIPTION OF RIL MAPPING PIPELINE: 1. Processing of raw markers scores and grouping: MadMapper_RECBIT generates multiple text files for further analysis 2. Construction of genetic map (ordering of markers) per linkage group: MadMapper_XDELTA(or any other mapping program) 3. Visualization and validation of genetic maps: CheckMatrixgenerates heat plots of recombination scores and graphical genotyping MadMapper and CheckMatrix are Python scripts and can be used on any computer platform: UNIX, Windows, Mac OS-X. Grouping can be done on a set of ~2,000 markers; map construction works in reasonable timeframe with up to ~500 markers grouping cutoff stringency distinct linkage group #4 Example of group analysis by MadMapper_RECBIT MINIMUM ENTROPY APPROACH TO INFER LINEAR ORDER OF MARKERS: CheckMatrix 2D plot: MadMapper_XDELTA analyzes two-dimensional matrices of all pairwise scores and finds best map that has minimal total sum of differences between adjacent cells (map with lowest ‘entropy’). random order high ‘entropy’ CheckMatrix Color Scheme partially wrong order Numerical data generated by MadMapper right order low ‘entropy’ Visualization of numerical data using ChekMatrix Two-dimensional matrix of recombination pairwise scores adjacent cells (values) Haplotypes per RIL (inbred line) [ red – Columbia; blue – L.erecta ] VISUALIZATION OF ARABIDOPSIS GENETIC MAP (DEAN AND LISTER, http://www.arabidopsis.info/ ) USING CHECKMATRIX [ MAP WAS RE-CONSTRUCTED USING MADMAPPER ] CHECKMATRIX USAGE: Three input files are required: ; 1 10 20 25 ; | | | | GM01 A A A A A A A A A A A A A A A A B B B B B B B B B GM02 A A A A A A A A A A A A A A A B B B B B B B B B B GM03 A A A A A A A A A A A A A B B B B B B B B B B B B GM04 A A A A A A A A A A A B B B B B B B B B B B B B B GM05 A A A A A A A A A A B B B B B B B B B B B B B B B GM06 A A A A A A A A A B B B B B B B B B B B B B B B B GM07 A A A A A A A A A B B B B B B B B B B B B B B A A GM08 A A A A A A A A A B B B B B B B B B B B B B A A A GM09 A A A A A A A A A B B B B B B B B B B B A A A A A GM10 B A A A A A A A A A B B B B B B B B B A A A A A A GM11 B B A A A A A A A A B B B B B B B B A A A A A A A GM12 B B B A A A A A A A B B B B B B B A A A A A A A A Locus file Linkage group I Linkage group I regions with negative linkage LG GM01 0 LG GM02 1 LG GM03 2 LG GM04 3 LG GM05 4 LG GM06 5 LG GM07 6 LG GM08 7 LG GM09 8 LG GM10 9 LG GM11 10 LG GM12 11 ................... GM01 GM07 0.36 GM01 GM08 0.40 GM01 GM09 0.48 GM01 GM10 0.52 GM01 GM11 0.60 GM01 GM12 0.68 GM02 GM01 0.04 GM02 GM02 0.00 GM02 GM03 0.08 GM02 GM04 0.16 GM02 GM05 0.20 GM02 GM06 0.24 ................... main diagonal with linked markers Linkage group II Linkage group II CheckMatrix Map file Matrix file Upon program execution three output files will be generated: 1 HEAT PLOT – it assists to validate the quality of constructed genetic map and identify markers with wrong position Linkage group III Linkage group III GRAPHICAL GENOTYPING: visualization of haplotypes per recombinant line (suspicious double crossovers are highlighted) high density of markers Linkage group IV Linkage group IV 2 low density of markers regions with quasi linkage CIRCULAR GRAPH – it assists to validate genetic map and identify markers with spurious linkage Linkage group V Linkage group V allele composition per markers 3 Linkage group I Linkage group II Linkage group III Linkage group IV Linkage group V CheckMatrix graphical genotyping 2-D diagonal ChekMatrix heat-plot: all markers versus all markers [color gradient reflects linkage scores between markers] REFERENCES AND DATA SOURCES: 1. Dean and Lister Arabidopsis Genetic Map and Raw Data: http://www.arabidopsis.info/new_ri_map.html 2. MadMapper: http://cgpdb.ucdavis.edu/XLinkage/MadMapper/ 3. JoinMap: http://www.kyazma.nl/index.php/mc.JoinMap 4. RECORD: http://www.dpw.wau.nl/pv/pub/recORD/index.htm 5. GenoPix_2D_Plotter http://www.atgc.org/GenoPix_2D_Plotter/ CREDITS: This work was funded by NSF grant # 0421630 to Compositae Genome Consortium http://compgenomics.ucdavis.edu/ PAG-14 POSTERS WITH EXAMPLES OF MADMAPPER USAGE: #P751 High-Density Haplotyping With Microarray-Based Single Feature Polymorphism Markers In Arabidopsis #P761 Gene Expression Markers: Using Transcript Levels Obtained From Microarrays To Genotype A Segregating Population LINEAR ORDER OF MARKERS INFERRED BY THREE DIFFERENT METHODS: physical coordinates of markers on Arabidopsis genome inferred order of markers by three different approaches (mapping programs) Side-by-side comparison of linear order of markers on Arabidopsis genome inferred by three different approaches (mapping programs) and comparison with physical order of markers (Col- 0 genomic sequence): MadMapper_XDELTA (minimum entropy approach), JoinMap (maximum likelihood) and RECORD (minimum number of recombination events) [Diagonal dot-plot was created using GenoPix_2D_Plotter] MadMapper JoinMap RECORD