Download
1 / 27
270 likes | 440 Views
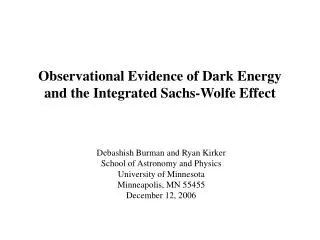
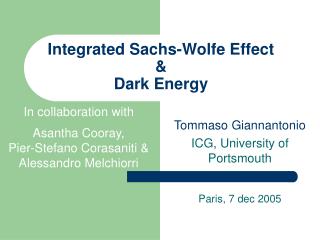
Detection of integrated Sachs-Wolfe effect by cross-correlation of the cosmic microwave background and radio galaxies. 中央研究院. Guo Chin Liu. Collaborators: Ue-Li Pen (CITA) K-W Ng(IoP, AS). 2007/12/20@NTHU. Hubble Diagram with 42 High-Redshift Supernovae.

E N D
Detection of integrated Sachs-Wolfe effect bycross-correlation of the cosmic microwave background and radio galaxies 中央研究院 Guo Chin Liu Collaborators: Ue-Li Pen (CITA) K-W Ng(IoP, AS) 2007/12/20@NTHU
Hubble Diagram with 42 High-Redshift Supernovae Something is missing for the “cosmological principle” based Friedmann universe. Standard candle? Evolution of SN Ia is small. D. Branch et al. 2001 Perlmutter et al. 1998 m+k+=1
Microwave Sky from WMAP CMB contains richest information of our universe. Expansion rate Age of universe Inflation model Content of universe Geometry of universe Thermal history (reionization) ……………
Statistics of CMB Sky Geometry of our universe ISW effect
Observation of CMB first peak alone does not guarantee the existence of dark energy. • We are living in low density universe, i.e., m0.3. Allen et al. 2002 Carlberg et al. 1997 • Hubble constant is not so small, for example, from SZ clusters measurement, H0=60-70Reese et al. 2002 Udomprasert et al 2004. m+k+=1 Spergal et al. 2007
Astronomical Observation for Dark Energy • Need to be sensitive on • Geometry of universe (distance vs. redshift relation) • 2. Structure formation Current used observations • Supernova type Ia : probe the geometry of universeCaution: assuming uniform intrinsic luminosity • CMB : good constraint on small curvatureCaution : no time evolution data • Large scale structure : evolution of geometry of universe and growth factor D(z) Caution: depend on CDM model for structure formation
Other possibilities Dark energy couples with cold dark matter : Changing matter power spectrum S. Lee, G. Liu & K. Ng PRD 2006 Coupling with CMB photons: Producing parity odd term in CMB polarization power spectra G. Liu, S. Lee & K. Ng PRL 2006
The physical quantity to be determined: Equation of state w(z)=p/ Cosmological constant: w=-1 Quintessence : wQ: w0, w0+(1-a)w1, oscillating…. a. Assume flat universe and const. w w=-1.05+0.15-0.2 Knop et al.2004 (SN) b. time evolution w=w0+ (1-a)w1 w0=-1.146+0.176-0.178 w1=0.6+0.622-0.652 --no dark energy perturbation w0=-1.118+0.152-0.147 w1=0.499+0.453-0.498 -- with dark energy perturbationG-B Zhao et al. 2006(SN+CMB+galaxy clustering) CDM explains observation data very well
Inhomogeneity Cosmological constant Dark energy
Cosmologists are often in error, but never in doubt Lev Landau
Future observation Weak lensing:Size of distortion image depends on distance traveled and growth factor BAO: Baryon Acoustic Oscillation is sensitive to dark energy through its effect on the angular-diameter distance vs. redshiftrelation and through its effect on the time evolution of the expansion rate. Clusters observation: growth rate and geometry of universe
Joint Efficient Dark-Energy Investigation (JEDI)* SN Ia 0<z<2* BAO 10-100 M galaxies, 1000-10000 deg^2* Weak lensing 1000-10000 deg^2 • SuperNova Acceleration Probe (SNAP)*SN Ia 0<z<1.7*Weal lensing
2 1 Second Hint from CMB • ISW effect (late)I • If the potential decays between the time a photon falls into a potential well andwhen it climbs out it gets a boost in temperature ofdue to the differentialgravitational redshift and due to an accompanying contraction of the wavelength • No ISW effect in matter dominate epoch. • The dark energy dominating on late epoch creates the temperatures anisotropies on large scales. E=|1-2| T/T=-2 d d/d
ISW effect II • Signature of dark energy • Probe of evolution of structure • Sensitive on large scale (horizon) • Difficult to detect Try to look forcorrelation of CMB with matter
Density fluctuation Form structures CMB gains energy Cross correlation of CMB with matter in local universeProposed by Crittenden & Turok (1996) • Possible tracers • NRAO VLA Sky Survey (NVSS) • Hard X-ray background(HEAO-1) • Sloan Digital Sky Survey (SDSS) • Two Micron All Sky Survey Extended Source Catalogue (2MASS XSC)
Contribution to Signal from different Redshift Crittenden & Turok PRL 1996
First detection of the cross-correlation Correlating CMB sky to hard X-rays (HEAO-1) and radio galaxy (NVSS) wiNiwjTj/wiwj 3 sigma detection for hard X-rays and 2.5 sigma for radio galaxy Boughn & Crittenden, nature, 2004
Contamination • Sunyaev-Zeldovich Effect: anisotropies generated through the inverse Compton scattering with free e- correlates with the galaxy itself. On small scales • Emission from the radio galaxyEmission at f<few tens GHz contaminates the microwave sky. On small scales • Primary CMB itself: △T(ISW) < 30% of △T(total)
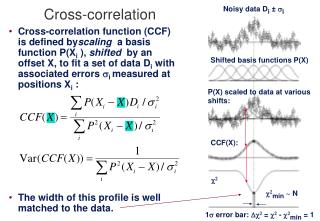
Details of this work I • We work at harmonic spaceSZ and radio emission is ignorable.Low correlation between each mode • ClNT=<aNlmaT*lm>△T/T()=aTlmYlm() • Using NVSS as matter distribution tracer. • Healpix software is used forvisualization and calculating alm
NVSS data 1. 1.4GHz , 82% sky coverage (>-40) 2. Sensitivity 2.5 mJy contains 1.8 million sources 3. Typical luminosity function models indicate 0z2 distribution
Detail II 41GHz 61GHz T T Q Q U U
CMB anisotropies & polarization on large scales CMB last scattering surface △TSW, z=1100 Generate P. for l>100 △Treion, z=10 Generate P for l < 30~50 △TISW, z<2 Dark energy dominates Observer
Correction by the information of polarization At large scales T=TSW + Tre+ TISW E(no ISW) =aT(no ISW) + n <TE> = a <TT> <EE>=a2<TT> + n2 T(ISW) =T – E/a * WF WF=a2<TT>/<EE>
Discussion & Summary • Working in harmonics space, signal with 2-sigma is detected in l~ 10-20. Though it is smaller than detection in real space, statistically it gives same information. • Primary CMB is the dominated noise in this cross-correlation. Using polarization information, we can filter out part of it. • It suppress the noise about 17%, 3% and 8.7% in band power l=3, 7 and 15. Give a better constrain on dark energy model.