Download
1 / 9
90 likes | 185 Views
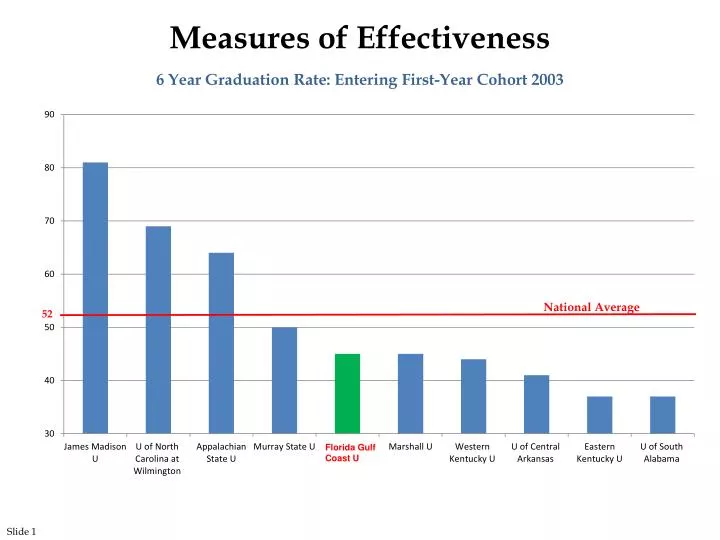
Measures of Effectiveness. 6 Year Graduation Rate: Entering First-Year Cohort 2003. National Average. 52. Florida Gulf Coast U. Slide 1. Measures of Effectiveness. 6 Year Graduation Rates. National Average. 52. FGCU. 48. 2013 Target. Florida Gulf Coast U. Entering Class Cohort.

E N D
Measures of Effectiveness 6 Year Graduation Rate: Entering First-Year Cohort 2003 National Average 52 Florida Gulf Coast U Slide 1
Measures of Effectiveness 6 Year Graduation Rates National Average 52 FGCU 48 2013 Target Florida Gulf Coast U Entering Class Cohort Slide 2
Measures of Effectiveness Graduation Rate for First Time in College Students (Full-time) Varies Widely Across the Universities Note: The 2004 Cohort for the University of South Florida includes the Main and St. Petersburg campuses. Source: OPPAGA analysis of College Navigator and the Integrated Postsecondary Education Data System (IPEDS). Slide 3
Measures of Effectiveness Post-Graduation Outcomes for Bachelor Degree Graduates in 2008-09 Varied Considerably Among the Universities 1 Continuing education includes degree and non-degree programs at Florida public institutions (2009-10). 2 October–December quarter of 2009. This does not include individuals who are self-employed or who found employment in other states. Source: OPPAGA analysis of the Florida Education and Training Placement Information Program. Slide 4
Measures of Efficiency Full-Time Equivalent Students per Full-Time Equivalent Faculty (2009 – 10) Florida Gulf Coast U (FTE: 11,830) (FTE: 9,494) (FTE: 10,653) (FTE: 17,463) (FTE: 8,632) (FTE: 18,646) (FTE: 16,534) (FTE: 14,243) (FTE: 13,335) (FTE: 12,188) Slide 5
Measures of Efficiency Full-Time Equivalent Students per Full-Time Equivalent Staff (2009 – 10) Florida Gulf Coast U (FTE: 11,830) (FTE: 9,494) (FTE: 17,463) (FTE: 16,534) (FTE: 18,646) (FTE: 8,632) (FTE: 14,243) (FTE: 13,335) (FTE: 10,653) (FTE: 12,188) Slide 6
Measures of Efficiency Florida State University Awarded the Highest Percentage of Degrees in 2009-10 Without Excess Hours1 • 1Within 110% of required hours as calculated by the Board of Governors. • Source: OPPAGA analysis of State University System, Florida Board of Governors. Slide 7
Measures of Compensation $ $80,000 $70,000 $60,000 $20,000 $10,000 Florida Gulf Coast University Slide 8
Measures of Compensation Comparison of Faculty Salaries by Rank (2009 – 10) $100,000 U of North Carolina at Wilmington Appalachian State U $90,000 Florida Gulf Coast University James Madison U U of South Alabama Western Kentucky U Eastern Kentucky U Murray State U $80,000 U of Central Arkansas Marshall U $70,000 $60,000 FGCU ASU $50,000 JMU EKU USA FGCU WKU $40,000 UCA MU $30,000 Slide 9