Real-Time Systems Performance Execution Analysis
150 likes | 180 Views
Understand the critical aspects of real-time systems performance analysis, including interrupt handling, task execution time, and meeting deadlines amid interrupt onslaught. Learn about interrupt priority levels, dynamic performance calculation, and optimizing system response.

Real-Time Systems Performance Execution Analysis
E N D
Presentation Transcript
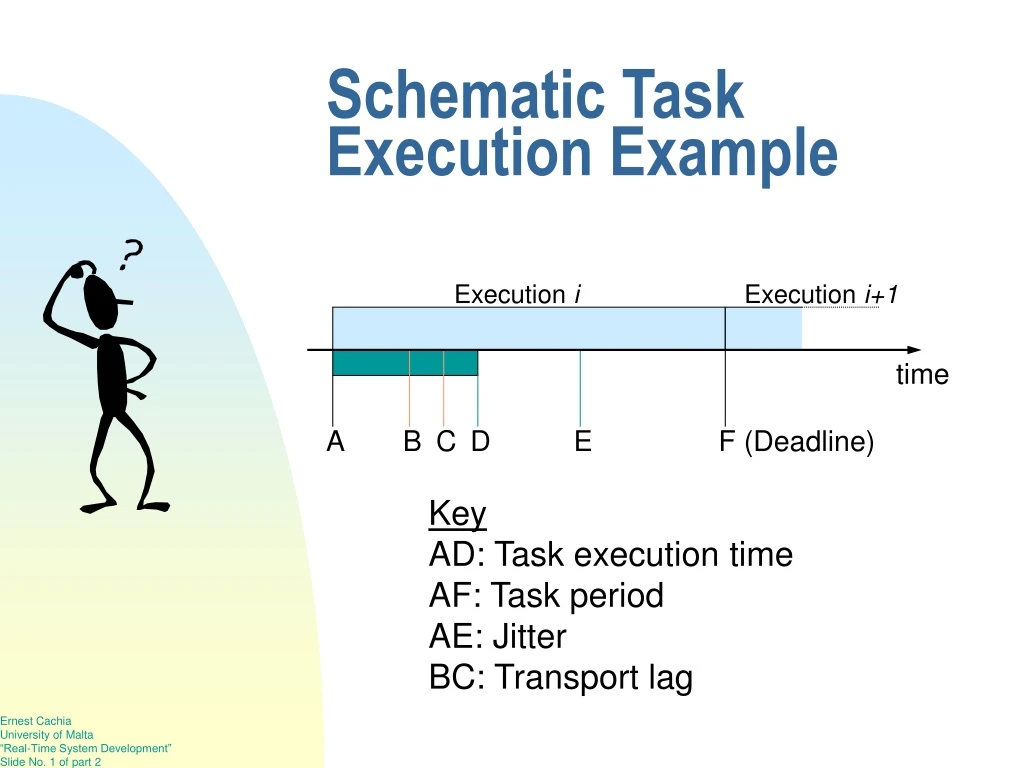
Execution i Execution i+1 time A B C D E F (Deadline) Schematic Task Execution Example Key AD: Task execution time AF: Task period AE: Jitter BC: Transport lag
More About Deadlines Usually defined as: • Hard If missed, usually result in some sort of system catastrophic failure • Firm If missed, usually cause the system to produce useless (or senseless) results • Soft If missed, usually deter from the usefulness of the results in direct proportion to the extent by which the soft deadline is missed
Performance of R-T Systems Main players are: • Response time • Context switching • Interrupt latency • Computation speed • Data storage access speed • Data transfer rate • Loads of hardware stats (I/O throughput, bus inertia, disk performance, memory/buffer size, controller performance, etc.)
Interrupt Handling • In non-R-T systems interrupts may be handled whenever deemed appropriate by the system • In R-T systems it’s the external world which dictates when the system is to respond. • Interrupts need not be sequential - meaning the allocation of priorities to different interrupts
3 Interrupt priority level 2 1 0 time Key Level 3 interrupt execution Level 2 “ “ Level 1 “ “ Normal computation priority Multi-priority Interrupts
Important Interrupt Modelling Facts • More than one real-world interrupt can arrive at any time • Interrupts can be interrupted by others with a higher priority • Too many interrupts can hinder overall R-T system performance • Devise ways by which to minimise the impact of multiple interrupts on the system
Dynamic performance calculation Take into account: • Average interrupt frequency • Average time required to service a serviceable interrupt • Other parts of the software that can interrupt their servicing It is of system-vital importance that the system remains capable of meeting all its time constraints even in the face of “interrupt onslaught”. Failure to do so will result in system collapse.
Part 1 of your assignment PLEASE SEE SEPARATE DOCUMENT, THE NAME OF WHICH WILL BE ANNOUNCED IN DUE COURSE, FROM WEBSITE DOWNLOAD OR ANNOUNCMENTS AREAS
R-T Task Classification • Periodic Execution starts at pre-defined intervals • Aperiodic Random execution start times • Server Resource sharing and synchronisation
Exceptions Deadline Jitter PERIODIC Priority Rate Execution time Timing constraints Deadline Usage constraints Priority APERIODIC Execution time Activation & execution conditions SERVER Activation & execution conditions Task Class Properties
Periodic Task 1 Aperiodic Task 1 Execution time = 20 ms Period = 100 ms Mean arrival time = 50 ms Execution time = 3 ms Deadline = 5 ms Server Task 1 Usage: 1(2 ms), 2(20 ms) Periodic Task 2 Execution time = 40 ms Period = 150 ms Deadline = 130 ms Server Task 2 Aperiodic Task 2 Usage: 1(10 ms), 3(10 ms) Periodic Task 3 Mean arrival time = 40 ms Execution time = 2 ms Deadline = 4 ms Execution time = 100 ms Period = 350 ms Example of R-T System Requirements(Based on example in “Software Engineering Fundamentals” by A. Behforooz et al.)
Execution Time Estimation Values required for calculation are: • Average instruction execution time • Interrupt latency • Very detailed description of task • I/O instruction execution time Interrupt latency is analysed in the following slide ...
1 2 3 4 5 6 7 Interrupt Latency Composition Interrupt latency Interrupt occurs Save state of current task Decode interrupt Start and complete interrupt actions Save state of interrupt Restore state of interrupted task Continue execution of interrupted task
Execution Time Estimation Example (1) Known quantities are: • Task rate (30 s-1) period of 33.33 ms • Longest exec. path (2900 sloc) • HLL-to-assembly expansion (6:1) • Interrupt latency (0.1 ms) • Av. int. trans. delay (0.85 ms) • Av. instruction exec. time (300 ns) • Assume a “cushioning” of 20%
Execution Time Estimation Example (2) • Max task execution time: 2900 sloc x 6 = 17,400 tloc • 1 tloc execution time: 0.0003 ms • Total tloc execution time: 17,400 tloc x 0.0003 ms = 5.22 ms • Total execution time for 1 task: (total tloc exe. + int. trans. delay + int. latency) 5.22 ms + 0.85 ms + 0.1 ms = 6.17 ms • Total periodic execution time: 6.17 ms x 30 tasks/s = 185.1 ms • Include cushioning (20%): 185.1 ms + 10.8 ms = 196 ms