Download

1 / 25
250 likes | 449 Views
U.S. Virgin Islands Wind Resources. Dennis Elliott National Renewable Energy Laboratory U.S. Virgin Islands Wind Workshop St. Thomas, Virgin Islands January 31, 2008. U.S. Virgin Islands Wind Resource Mapping Project. Collaborative effort involving:. DOE/NREL Wind Powering America program

E N D
U.S. Virgin Islands Wind Resources Dennis Elliott National Renewable Energy Laboratory U.S. Virgin Islands Wind Workshop St. Thomas, Virgin Islands January 31, 2008
U.S. Virgin Islands Wind Resource Mapping Project Collaborative effort involving: • DOE/NREL Wind Powering America program • U.S. Virgin Islands • NREL’s wind resource group • AWS Truewind
High-Resolution Wind Mapping Approach • Comprehensive modeling and validation process produced detailed wind resource maps with a spatial resolution of 200 m • AWS Truewind used a numerical weather model with climatic data and wind flow model to produce the preliminary maps • NREL and expert consultants validated preliminary maps of 50-m annual average wind resource using • Available high-quality wind measurement data • Knowledge of wind resources in the region and other information • 70-m and 100-m wind maps also produced but not validated due to lack of tall-tower data • Final wind resource maps developed based on revision of preliminary maps from validation results
Logic of Numerical Mapping Method • Model Design and Outputs • MesoMap - created by AWS Truewind • A numerical weather model (MASS) coupled to a wind flow model (WindMap) and global weather, topographical, and land cover data • NCEP/NCAR Reanalysis (200-km grid) - most important global weather input for MASS • MASS simulates weather conditions (including winds) over 365 random days selected from a 15-year period • MASS runs to 2.5 km and WindMap to 0.2 km • Model output grids provided to NREL for review and validation
Wind Power Density vs Capacity FactorU.S. Virgin Islands: Weibull k range 2.5-3.5US Continental (many areas): Weibull k range 1.5-2.5
Wind Power vs Wind Speed Maps for U.S. Virgin Islands? • Wind power density and equivalent wind power class • NOT a reliable indicator of wind turbine power output (capacity factor) in U.S. Virgin Islands • Evidence: • Wind power density in VI trade wind climate can be 30-50% less than many continental US areas with same mean wind speed • Wind power class on VI map can be 1 to 3 classes lower than for many continental US areas with same wind speed • Capacity factor for advanced wind technology NOT significantly different at mean wind speeds of 7 m/s and greater • Therefore, wind speed maps used instead of wind power density maps to characterize U.S. Virgin Islands’ wind resources
Examples of Wind Power Class and Capacity Factor Mean wind speed = 7.0 m/s but different Weibull k • California wind corridor • Weibull k = 1.5, Power Class = 5, Capacity Factor = 35% • Eastern U.S. • Weibull k = 2, Power Class = 4, Capacity Factor = 36% • Midwest U.S. • Weibull k = 2.5, Power Class = 3, Capacity Factor = 36% • U.S. Virgin Islands • Weibull k = 3, Power Class = 2, Capacity Factor = 35% Note: Capacity factors are rounded to the nearest whole percent
Wind Measurement Data for Map Validation • Data from 4 measurement towers and 2 airports
Annual average shear exponents can vary from 1/7 to 0.25, causing considerable uncertainty in vertical extrapolations of wind resource
Even if 50-m wind resource is known, potential variations in shear exponents cause considerable uncertainty in wind resource at heights of 80-100 m • Measured shear exponent at Goodland IN is 0.235, with much higher wind resource at 90 m than estimated by 1/7 shear estimate
High wind shear locations can have considerably higher capacity factors at 80-100 m than low shear locations, given similar capacity factors at 50 m • Goodland’s capacity factor of 42.5% at 90 m is considerably higher than would be estimated by using typical shears of 1/7 to 0.2
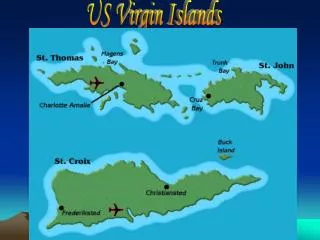
Trade Winds in U.S. Virgin Islands Maximum annual average wind speeds 800-1000m elevation Seasonal variations in strength and depth of trade winds Peak winds June-Aug and Dec-Feb Terrain and roughness can cause considerable variation in the local wind resource
Summary of Wind Resourcesin the U.S. Virgin Islands • Good wind resource areas can be found on many exposed ridge crests and coastal areas • Maximum wind resource is generally Jun-Aug and Dec-Feb but can vary somewhat from year-to-year • Diurnal wind climate varies considerably throughout VI • No significant diurnal variations on exposed eastern capes and ridge crests • Slightly greater night time winds on highest ridge crests • Daytime max winds most other areas • Tall-tower measurements (up to 80-100m+) and remote sensing (sodar/lidar) needed to • Estimate the wind shear at elevated heights of 50-100m+ • Characterize wind resource at hub-heights of advanced wind turbines