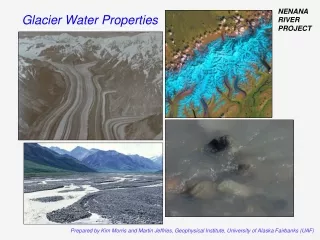
Glacier Water Properties
220 likes | 248 Views
This project explores the properties and dynamics of glacier water in the Nenana River. It examines the water cycle, glacier formation and melting, river hydrology, erosion processes, and precipitation effects.

Glacier Water Properties
E N D
Presentation Transcript
NENANARIVERPROJECT Glacier Water Properties Prepared by Kim Morris and Martin Jeffries, Geophysical Institute, University of Alaska Fairbanks (UAF)
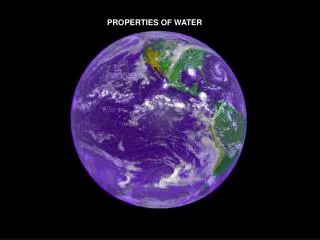
NENANARIVERPROJECT The Water Cycle Prepared by Kim Morris and Martin Jeffries, Geophysical Institute, University of Alaska Fairbanks April, 2008 The amount of water on Earth does not change. It’s place in the water cycle and its phase do change. Water is in storage when it is frozen. This can be either short- (snow and annual ice) or long- (glaciers) term storage. http://www.usgcrp.gov/usgcrp/images/ocp2003/ocpfy2003-fig5-1.htm
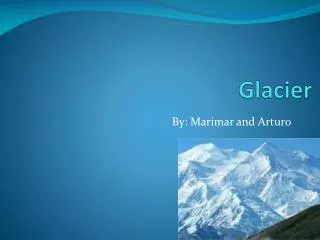
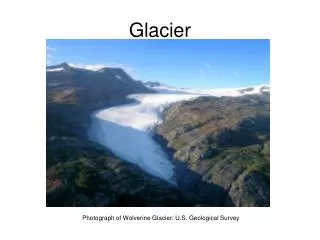
NENANARIVERPROJECT Glaciers Prepared by Kim Morris and Martin Jeffries, Geophysical Institute, University of Alaska Fairbanks April, 2008 Glaciers are perennial accumulations of ice, snow,sediment, rock and water. They respond to changes in temperature, snowfall and geologic forces.
NENANARIVERPROJECT River Hydrology, I Prepared by Kim Morris and Martin Jeffries, Geophysical Institute, University of Alaska Fairbanks April, 2008 Hydrology is the science dealing with the properties, distribution, and circulation of water; the seasonal patterns of a river’s flow. These hydrographs of the Nenana River near Healy, AK show the variability of the water flow within a single year and between years.
NENANARIVERPROJECT River Hydrology, II Prepared by Kim Morris and Martin Jeffries, Geophysical Institute, University of Alaska Fairbanks April, 2008 Sources of Water for Rivers Precipitationevents (rainfall): Relatively short (hours to days), low volume water pulse. Snow melt: Mid-term (days to weeks), high volume pulse of water. Glacier melt: Long term (months), mid-volume pulse of water.
NENANARIVERPROJECT River Hydrology, III A simplified diagram of glacier mass budget, showing major mass input (snowfall) and outputs (melting, and runoff). www.glaciers.pdx.edu/ Skagit/Basics00.html Average daily discharge per month for the Skagit River below Ross Dam and average monthly precipitation at Newhalem Washington. Prepared by Kim Morris and Martin Jeffries, Geophysical Institute, University of Alaska Fairbanks April, 2008 An Example of a Glacier-fed River Hydrology Beginning in spring the accumulated snow melts, feeding alpine streams. By late summer, much of the seasonal snow cover has disappeared from the landscape. The glaciers continue to melt and this water supplies the river during the driest part of the northwest summer. This is particularly important for summer during drought years.
NENANARIVERPROJECT River Hydrology, IV Prepared by Kim Morris and Martin Jeffries, Geophysical Institute, University of Alaska Fairbanks April, 2008 Diurnal Glacial Water Flow Meltwater from Vadret da Morteratsch, Grisons, Switzerland. The upper picture was taken on a July morning. The lower picture was taken in the afternoon after ablation and subsequent runoff had both increased considerably. Photo J. Alean. http://www.swisseduc.ch/glaciers/glossary/glacier-milk-en.html
NENANARIVERPROJECT Erosion Prepared by Kim Morris and Martin Jeffries, Geophysical Institute, University of Alaska Fairbanks April, 2008 Erosion is the displacement of solids (soil, mud, rock and other particles) by wind, water, or ice in downward or down-slope movement in response to gravity. Weathering is the breaking down of rock and particles through processes where no movement is involved, although the two processes may be concurrent. The rate of erosion depends on many factors including the amount and intensity of precipitation, the texture of the soil, the gradient of the slope and ground cover (vegetation, bare ground, land use). http://extension.missouri.edu/explore/agguides/agengin/g01509.htm
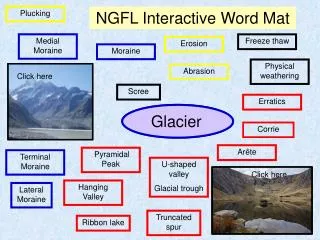
NENANARIVERPROJECT Glacier Erosion, I Prepared by Kim Morris and Martin Jeffries, Geophysical Institute, University of Alaska Fairbanks April, 2008 Rocks and sediments are added to glaciers through various processes. Glaciers erode the terrain principally through two methods: abrasion and plucking. Plucking is a two part process. When glaciers flow over the fractured bedrock surface, subglacial water penetrates the fractures. When this water freezes it expands and breaks the rock. The ice expansion also acts as a lever that loosens the rock by lifting it. Consequently, sediments of all sizes become part of the glacier's load. Abrasion occurs when the ice and the load of rock fragments slide over the bedrock and function as sandpaper that smoothes and polishes the surface situated below. This pulverized rock is called rock flour (0.002 and 0.00625 mm).
NENANARIVERPROJECT Glacier Erosion, II Prepared by Kim Morris and Martin Jeffries, Geophysical Institute, University of Alaska Fairbanks April, 2008 Sediment and debris can also accumulate on a glacier’s surface due to: avalanches, rock falls and wind deposition.
NENANARIVERPROJECT Precipitation Erosion, I Prepared by Kim Morris and Martin Jeffries, Geophysical Institute, University of Alaska Fairbanks April, 2008 During storms, soil is washed from the stream banks into the stream. The amount that washes into a stream depends on the type of land in the river's watershed and the vegetation surrounding the river. http://ga.water.usgs.gov/edu/characteristics.html#Sediment
NENANARIVERPROJECT Precipitation Erosion, II Prepared by Kim Morris and Martin Jeffries, Geophysical Institute, University of Alaska Fairbanks April, 2008 Splash erosion: Raindrops splash soil particles short distances. These particles are then much more vulnerable to erosion by water flowing over the surface. Sheet erosion: When rain falls faster than the soil can absorb it, water begins to collect and flow over the ground surface. Sheet erosion begins when this surface water begins to carry along particles that were detached by raindrops. Rill and gully erosion: A rill is a narrow and shallow incision into soil resulting from erosion by overland flow that has been focused into a thin thread by soil surface roughness. As the rill increases in size it becomes a gully, a highly erosive water structure. These usually occur due to a high water flow. Stream and channel erosion: This is mostly caused by downward scour due to flow shear stress. Side wall sluffing can also occur during widening of the channel caused by large flows.
NENANARIVERPROJECT River Sediment Transportation, I Prepared by Kim Morris and Martin Jeffries, Geophysical Institute, University of Alaska Fairbanks April, 2008 For a fluid to begin transporting sediment, the bed shear stress exerted by the fluid must exceed the critical shear stress of the bed. Rivers pick up and carry material as they flow downstream. A river may transport material in four different ways: Traction - large boulders and rocks are rolled along the river bed Saltation - small pebbles and stones are bounced along the river bed Suspension - fine light material is carried along in the water Solution - minerals are dissolved in the water Rivers need energy to transport material, and levels of energy change as the river moves from source to mouth.
NENANARIVERPROJECT River Sediment Transportation, II Sediment class Size (mm) Sand V. Coarse 1.5 Medium 0.375 V.Fine 0.094 Silt V. Coarse 0.047 Medium 0.0117 (no longer visible to the human eye) V.Fine 0.0049 Clay < 0.00195 http://www.water.ncsu.edu/watershedss/info/turbid.html Prepared by Kim Morris and Martin Jeffries, Geophysical Institute, University of Alaska Fairbanks April, 2008 When energy levels are very high, large rocks and boulders can be transported. Energy levels are usually higher near a river's source, when its course is steep and its valley narrow. Energy levels rise even higher in times of flood. When energy levels are low, only small particles can be transported (if any). Energy levels are lowest when the river enters the final stages of its journey (at the mouth). When a river loses energy it deposits some of the material it has been carrying.
NENANARIVERPROJECT River Water Conductivity Prepared by Kim Morris and Martin Jeffries, Geophysical Institute, University of Alaska Fairbanks April, 2008 Water is called the “universal solvent”. This means it has the ability to dissolve other substances. There is hardly a substance known which has not been identified in solution in the earth's waters. Electrical conductivity is the ability of a material to carry electrical current. In water, it is generally used as a measure of the mineral or other ionic concentration. Conductivity is a measure of the purity of water or the concentration of ionized chemicals in water. However, conductivity responds to all ionic content and cannot distinguish particular conductive materials in the presence of others. Only ionizable materials will contribute to conductivity; materials such as sugars or oils are not conductive. High Purity Water Conductivity vs Temperature Conductivity vs Concentrations at 25°C Conductivity is affected by temperature since water becomes less viscous and ions can move more easily at higher temperatures. Conventionally, conductivity measurements are referenced to 25°C though occasionally a 20°C. http://www.wileywater.com/Contributor/Sample_2.htm
NENANARIVERPROJECT River Water Turbidity Prepared by Kim Morris and Martin Jeffries, Geophysical Institute, University of Alaska Fairbanks April, 2008 Turbidity is a unit of measurement quantifying the degree to which light traveling through a water column is scattered by the suspendedparticles. The scattering of light increases with a greater suspended load. The more total suspended solids in the water, the murkier it seems and the higher the turbidity. There are various parameters influencing the cloudiness of water. Some of these are: Phytoplankton Sediments from erosion Re-suspended sediments from the bottom (frequently stir up by bottom dwellers) Waste discharge Algal growth Urban runoff
NENANARIVERPROJECT River Water Quality - Field Sampling, I Measuring turbidity provides a cheap estimate of the total suspended solids or sediments (TSS) concentration (in milligrams dry weight/L). Field Procedure 1) Label the sampling bottle lids before a water sample is taken. Use masking tape and marker pen (Sharpie) and include the location (Anderson, Healy, DEC, Cantwell) and date (expressed as YY/MM/DD, e.g., 07/10/06). A sample number, e.g., #1, should also be included, even if only one sample is taken. • 2) Obtain a water sample from a free-flowing part of the river. Rinse the bottle in the river water before collecting a water sample. Fill the 500 mL sampling bottle to nearly full. If sampling is to be done by walking part way into the water USE EXTREME CAUTION. Students should never enter the water unsupervised by an adult. • 3) Secure the lid tightly to the bottle once the sample is obtained. • 4) Return water samples to the classroom for analysis. Prepared by Kim Morris and Martin Jeffries, Geophysical Institute, University of Alaska Fairbanks April, 2008
NENANARIVERPROJECT River Water Quality - Field Sampling, II Prepared by Kim Morris and Martin Jeffries, Geophysical Institute, University of Alaska Fairbanks April, 2008
NENANARIVERPROJECT River Water Quality - Conductivity Nenana River Conductivity/TDS Meter Prepared by Kim Morris and Martin Jeffries, Geophysical Institute, University of Alaska Fairbanks April, 2008 Laboratory Procedure 1) Set-up the Conductivity/TDS Meter as per the instructions in the manual. 2) Shake the 500 ml sampling bottle. 3) Immerse the head of the Conductivity/TDS Probe into the water up to the immersion level. During the measurement the lower LCD display will show the temperature of the solution. 4) Record the water temperature value. 5) Record the conductivity values (mS). 6) Record the TDS (P) Note: From time to time it will be necessary to re-calibrate the conductivity meter.
NENANARIVERPROJECT River Water Quality - Suspended Sediment, I Prepared by Kim Morris and Martin Jeffries, Geophysical Institute, University of Alaska Fairbanks April, 2008 Laboratory Procedure- Part I 1) Shake the 500 mL sampling bottle to make sure that the sediment is evenly distributed throughout the water (depending on how long the sample has been in the bottle sediment may have begun to settle on the bottom of the bottle). 2) Pour thewater into one of the graduated cylinders until the water level reaches the 250 mL mark. 3) Fold a paper filter and place it in the filter funnel. 4) Place the filter funnel and paper into the second 250 ml graduated cylinder. 5) PourALL of the water in the first 250 mL cylinder into the second 250 mL cylinder through the funnel and paper. This may take a few minutes, and it may be necessary to support the funnel so that the cylinder does not fall over. 5) Remove the paper filter (with sediment) from the filter funnel, and set aside. 6) Dry the filter paper and sample in a location where it will not be disturbed. (This can be done in the oven at 200°F - do not unfold the filter.)
NENANARIVERPROJECT River Water Quality - Suspended Sediment, II Prepared by Kim Morris and Martin Jeffries, Geophysical Institute, University of Alaska Fairbanks April, 2008 Laboratory Procedure- Part II Once the sediment sample is completely dry: 1) Set up the digital balance on a level surface. Calibrate if necessary. Make sure that the scale is set to grams. Do not use in a draughty place. 2) Place a dry, unused paper filter on the balance, record its mass, then tare the scale. 3) Weigh the dried sediment sample filter and sample and record its mass. Calculate TSS TSS(mg/L) = A/B where: A = Dried weight of the sediment (in milligrams) B = Volume of water filtered (in Liters) Note: 1 g = 1000 mg and 1 liter = 1000 milliliters
NENANARIVERPROJECT Water Quality Data Sheet Prepared by Kim Morris and Martin Jeffries, Geophysical Institute, University of Alaska Fairbanks April, 2008