Download

1 / 20
200 likes | 218 Views
This study examines the social inequalities in adult alcohol-related mortality in England and Wales using the National Statistics Socio-economic Classification (NS-SEC). It analyzes mortality rates by NS-SEC, gender, age, and region, and explores possible causes for these inequalities. The findings highlight substantial disparities in alcohol-related mortality and higher mortality rates among those in less advantaged classes.

E N D
Social inequalities in alcohol-related mortality by NS-SEC(England and Wales, 2001-03) Véronique Siegler, Alaa Al-Hamad, Brian Johnson Office for National Statistics (ONS), Health and Life Events Division (HLED) Nick Sheron, Southampton University
Overview of presentation • Aim of study (Historical perspective ; inequalities and gender; inequalities and age) • Methods (Causes of death included in the analysis, NS-SEC, data sources, measures of inequalities) • Findings (Mortality rates by NS-SEC; by gender, age and region) • Possible causes of inequalities in alcohol-related mortality • Conclusion
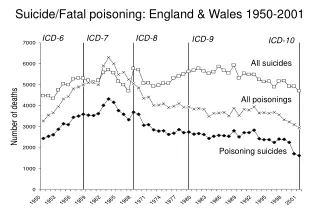
Aim of study • Recent literature suggest social gradient in alcohol-related mortality for men (Breakwell et al., 2007; Romeri et al., 2007; Harrison and Gardiner, 1999) • By contrast, earlier data suggest a reversed social gradient in alcohol-related mortality for men in the middle of the 20th century (OPCS, 1951) • Recent literature suggest a possible change in the pattern of inequalities in alcohol-related mortality for women in the last 20 years (Erskine et al., 2010; Breakwell et al., 2007; Harrison and Gardiner, 1999)
Aim of study - People in England and Wales are increasingly dying from alcohol-related causes at earlier ages (ONS Mortality data, 2011) - Inequalities in mortality wider at younger ages over the past 20 years for both men and women (Erskine et al., 2010; Harrison and Gardiner, 1999) Our study is the first analysis of the social inequalities in adult alcohol-related mortality in England and Wales using the National Statistics Socio-economic Classification (NS-SEC)
Data sources Data for men aged 25-64 and women aged 25-59, in Wales, England and the regions of England: • DEATH REGISTRATIONS - numerator - Cause of death (ICD-10) - Age, sex, occupation and employment status (NS-SEC) - Region • CENSUS 2001 - denominator (Person Years at Risk) - Age, sex, occupation and employment status (NS-SEC) - Region
Measure of inequalities • Age-specific mortality rates by five-year age group and by NS-SEC • European Age-standardised mortality rates by NS-SEC and region Adjustments to mortality and population data – for more details see Siegler et al., HSQ 50 • Socio-economic gradients (ratios between mortality rates in NS-SEC class 7 and in NS-SEC class 1)
Adjusted number of alcohol-related deaths by NS-SEC, 2001-03
Age-specific mortality from alcohol-related causes of death by five-year age group and NS-SEC, men aged 25-64, England and Wales, 2001-03
Age-specific mortality from alcohol-related causes of death by five-year age group and NS-SEC, women aged 25-59, England and Wales, 2001-03
Socio-economic gradients (Mortality ratios NS-SEC class 7: NS-SEC class 1)
Age-standardised mortality rates from alcohol-related causes of death by NS-SEC, men aged 25-64 and women aged 25-59, England and Wales, 2001-03
Overall mortality rates and socio-economic gradients in mortality for alcohol-related cause of death, regions of England and Wales, 2001-03
Summary of results (1) • Substantial inequalities in adult alcohol-related mortality were observed • Inequalities in mortality were greater for women than for men • Both men and women in the less advantaged classes (NS-SEC classes 5, 6, 7) had significantly higher mortality rates than in England and Wales as a whole • Greater inequalities in mortality were observed for younger men aged 25-49 than for men aged 50-64 • Highest mortality rate of men: Routine workers (NS-SEC 7) aged 50-54 (52.2 per 100,000)
Summary of results (2) • Women in Routine occupations (NS-SEC class 7) experienced mortality rates markedly higher than other classes • Mortality rate of women in Routine occupations (22.4 per 100,000) was similar to that of men in the Lower supervisory and technical class (NS-SEC class 5) • Highest mortality rate of women: Routine workers (NS-SEC 7) aged 45-49 (42.0 per 100,000)
Summary of results (3) • Within England, the largest overall mortality rate was found in the North-West, with particularly high mortality rates in the Routine class for both men and women • The highest inequalities were observed in Wales for men and in London for women, although with no statistical significance • The inequalities in mortality were higher for women than for men in all regions with the exception of the North East • In general, there was no association between levels of mortality and inequalities in mortality across the English regions and Wales
Possible reasons for inequalities in alcohol-related mortality • Co-factors(Hart et al., 2010; Liu et al., 2010) • Social selection effects (Blane et al., 1999) • Alcohol intake; however, inverse relationship in alcohol intake suggested by repeated population-based sampling surveys(GLS, 2009). • Drinking patterns might vary across socio-economic classes (Marmot review, 2010; Jefferis et al., 2007). Those patterns might have been acquired at a young age(Baker and Rooney, 2003: birth cohort effect). • Trends in alcohol pricing(Brennan et al., 2009).The fact that alcohol has become more affordable might affect different socio-economic groups differently.
Conclusion The large inequalities in alcohol-related mortality cannot be readily explained in terms of differences in the amounts of alcohol consumed. Further research is needed to identify what additional factors may determine the higher mortality risk found in the less advantaged NS-SEC classes. You can download the paper at: http://www.statistics.gov.uk/cci/article.asp?id=2685
Thank you for your attention! • Any questions?