Download
1 / 28
280 likes | 302 Views
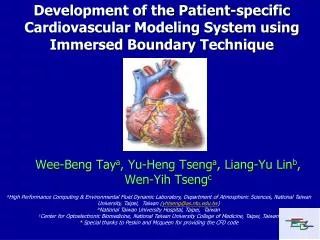
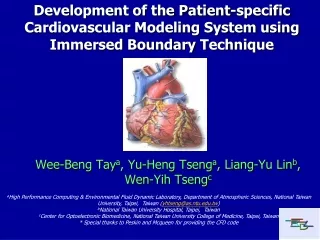
Development of the Patient-specific Cardiovascular Modeling System using Immersed Boundary Technique. Wee-Beng Tay a , Yu-Heng Tseng a , Liang-Yu Lin b , Wen-Yih Tseng c.

E N D
Development of the Patient-specific Cardiovascular Modeling System using Immersed Boundary Technique Wee-Beng Taya, Yu-Heng Tsenga, Liang-Yu Linb, Wen-Yih Tsengc aHigh Performance Computing & Environmental Fluid Dynamic Laboratory, Department of Atmospheric Sciences, National Taiwan University, Taipei, Taiwan (yhtseng@as.ntu.edu.tw) bNational Taiwan University Hospital, Taipei, Taiwan cCenter for Optoelectronic Biomedicine, National Taiwan University College of Medicine, Taipei, Taiwan * Special thanks to Peskin and Mcqueen for providing the CFD code
Outlines • Introduction • Patient-specific Cardiovascular Modeling System • 4-D MRI system • Numerical methods • Results from the cardiovascular heart models • Conclusion and future work
Introduction • Develop a CFD based, patient-specific cardiovascular modeling system • Facilitate physicians’ diagnosis at early stage through hybrid CFD simulation and 4-D MRI • Use Immersed boundary method (IBM) to simulate fluid-elastic interaction of heart • Investigate the vortex dynamic and effects of reservoir pressure boundary condition (RPBC) on the flows in Left Ventricle (LV)
Patient-specific Cardiovascular Modeling System • Methodology Idealized cases Healthy volunteer/ patient 4D-MRI system IBM heart model Visualization, KE, vorticity etc Image u(t),v(t),w(t) Comparison Diagnostic
Patient-specific Cardiovascular Modeling System • 4-D phase contract magnetic resonance imaging (PC-MRI) system • Currently at the National Taiwan University Hospital • Images acquired using an eight-channel phased-array body coil • Time-resolved 3D hemodynamic velocity fields • Allows one to reconstruct the 3D images of the heart over a cardiac cycle • Data comprises of both healthy volunteer as well as patients with cardiac problems for comparison
Patient-specific Cardiovascular Modeling System • Image resolution at 192x256x8 • Extracted slice at z=3, T=0.2
Patient-specific Cardiovascular Modeling System • Kinetic Energy (KE) of 4D-MRI system 2nd peak of KE (atrial contraction phase) 1st peak of KE (left ventricle filling phase)
Numerical Method – IBM (Mcqueen and Peskin, 2000) • Incompressible Navier-Stokes equations (f represents force density) • Interaction between immersed boundary, fluid and boundary forces
Numerical Method - IBM Fibers exert force onto the fluid Resulting velocity obtained by solving NS equations Return to calculate fiber’s velocity from surrounding fluid's velocity Shift fibers to new positions
Sensitivity of the pressure inflow conditions Reservoir pressure boundary condition (RPBC) 5 sources of RPBC at (a) superior (b) inferior vena cava (c) pulmonary vein (d) artery (e) aorta 1/4/2020 10
Sensitivity of the pressure inflow conditions • Influence of reservoir pressure boundary condition (RPBC) • Investigate the effects/impacts of different pressure BC on the simulation results • Study vortex dynamics of left ventricle (LV)
Sensitivity of the pressure inflow conditions • RPBC vs. T (data set 1 to 3)
Sensitivity of the pressure inflow conditions • RPBC vs. T (data set 4) 1/4/2020 13
Results and Discussions • Hemodynamic comparison for PV During initial LV filling phase, higher pressure BC gives higher blood inflow at the PV Towards end of LV filling phase, decrease and reverse in flow rate for all data sets except that of data set 4 (realistic pressure BC)
Results and Discussions • Hemodynamic comparison for aorta Minimal difference in flow rate of aorta for different data sets during initial filling of blood in the LV When systole phase begins , there is a large outflow rate
Results and Discussions (Domenichiniet al., 2007) • Volunteer flow rate data Similar outflow at aorta during systolic phase, at a earlier time compared to earlier data sets
Results and Discussions • Vorticity visualization (data set 1) • 2D vorticity plots obtained by extracting a slice of the Z vorticity at z=73.0 A pair of opposing signs vortices can be seen for all data sets Note that the z direction is into plane
Results and Discussions • Vorticity visualization • Fortini et al. (2008) model left ventricle using conical sack made of silicone rubber • Experiments by Fortini et al. show similar two vortices of opposite signs, same as simulation
Results and Discussions (Gharib et al., 2006) • Vortex formation time Tv • A good indicator of the cardiac health of the patient • EDV = LV end-diastolic volume (LV filling), • = time-averaged mitral (annulus) valve diameter, • EF = ejection fraction, • ESV = LV volume at the end of systole (LV ejection), • SV = the stroke volume, difference between ESV and EDV
Results and Discussions • Vortex formation time Tv • EDV, ESV obtained by approximating heart as a 3-D volume comprising of many polygons • by calculating the diameter of mitral annulus, which is represented as a 2D surface • Expected value of Tv for healthy volunteer is 3.3< Tv <5.5 • Tv very sensitive to small differences in . Power cube in equation causes small differences to be magnified. (Gharib et al., 2006)
Results and Discussions • Kinetic Energy (KE) of data set 1 (x=65 slice) 2nd lower peak of KE (atrial contraction) 1st higher peak of KE (LV filling)
Results and Discussions • Kinetic Energy (KE) of 4D-MRI system Similar 2nd peak of KE as data set 1 Similar 1st peak of KE as data set 1
Results and Discussions • Maximum KE vs. T for data set 1 to 4 Data set 4, which has realistic pressure BC, shows only one peak Data set 2 (-25% PV) also has two peaks, but the later peak is much higher than the first Data set 3 (+25% PV) similar to data set 1
Results and Discussions (Domenichini et al., 2007) • Inlet flow rate of patient data 2nd peak flow rate, similar to 2nd peak in KE during A-wave (atrial contraction) 1st peak flow rate, similar to 1st peak in KE during E-wave (LV filling)
Conclusions • Patient specific cardiovascular modelling system • Simulation of heart using IBM • 4D PC-MRI system • Investigate the effect of reservoir pressure BC on different variables such as KE, vorticity etc • Verified with experimental results from MRI and other means through KE, vorticity • Further investigation of the realistic reservoir pressure BC is required
References • Abdallah, H., "Pressures and the Heart: How Pressures Change in the Heart." http://www.childrensheartinstitute.org/educate/bloodprs/prchange.htm, 2009 • Domenichini, F., Querzoli, G., Cenedese, A., and Pedrizzetti, G.: Combined experimental and numerical analysis of the flow structure into the left ventricle. Journal of Biomechanics 40, 1988-1994, 2007 • Fortini, S., Querzoli, G., Cenedese, A., and Marchetti, M., "The Effect of Mitral Valve on Left Ventricular Flow," in 14th Int Symp on Applications of Laser Techniques to Fluid Mechanics Lisbon, Portugal, 2008 • Gharib, M., Rambod, E., Kheradvar, A., Sahn, D. J., and Dabiri, J. O., "Optimal vortex formation as an index of cardiac health," in Proceedings of the National Academy of Sciences of the United States of America, Vol. 103, Apr 2006, pp. 6305-6308 • McQueen, D. M. and Peskin, C. S., "A three-dimensional computer model of the human heart for studying cardiac fluid dynamics," in Computer Graphics-Us, Vol. 34, Feb 2000, pp. 56-60
Q&A 1/4/2020 28