Quantitative Research methodologies
This article explores the two fundamental quantitative research methodologies: descriptive and experimental. Descriptive research focuses on identifying patterns by examining who, where, when, and how much, while experimental research aims to understand cause-and-effect relationships between variables. The importance of rigorous design and execution is emphasized across methodologies. Additionally, a case study involving the Capability Maturity Model (CMM) and software project success highlights the correlation between software process maturity and development outcome, providing insights into the application of correlation analyses and statistical methods.


Quantitative Research methodologies
E N D
Presentation Transcript
Quantitative Research methodologies
Descriptive - researcher is concerned with finding out who, where, when or how much AS IT IS Experimental - researcher is concerned with learning why, how one variable produces change in another CAUSE & EFFECT RELATIONSHIPS Quantitative Studies
Descriptive and Casual • Whatever the type, both • demand good research skills • insist on the same high standards for design and execution
Cause • Referring to a kind of prediction • predictions can be considered to reflect cause only when all the relevant information is considered • of course, we can never know all the relevant information
Descriptive Research Designs • Correlational research • developmental designs • observation studies • survey research • all of these approaches yield quantitative data that can be summarized through statistical analyses.
Correlational Research • Examines the extent to which differences in one variable are related to differences in one or more other variable • A correlation exists, if when one variable decrease, the other variable either increases or decrease in a somewhat predictable manner
Data Pairs • Every data point is a pair, one for each of the characteristic being measured. • The researcher uses these pairs to calculate a correlation coefficient. • Using a scattergram allows a visual inspection of the relationship between variables.
Age Reading Grade Level
Values of correlation coefficient • Range +1.00 (perfect positive correlation) • -1.00 (perfect negative correlation) • 0.0 (unrelated) • Rare to find perfect correlation, generally moderate
Inspecting a Scattergram • Look at the extent the homogeneity of the variables (only C program with LOC > 5,000) or heterogeneity (C and VB program from 500 to 10,000 LOC) • Describe the degree to which the variables are related ( correlation coefficient) • Interpret these data and give them meaning
An Example of a Correlational Study A Correlational Study of the CMM and Software Development Performance
The Software Engineering Institute's (SEI) Capability Maturity Model (CMM) is widely used to measure an organization's software development process maturity. The Department of Defense (DoD) has adopted this model with the belief that a more mature software development process will result in a more successful software project. Although there is a growing body of anecdotal evidence that supports this presumed correlation, we were unable to find any studies that validate this premise.
The study reported in this article--master's thesis research at the Air Force Institute of Technology (AFIT)--set out to find empirical evidence to determine if the premise could be validated. The goal of our research was to determine the nature of the correlation, if any, between software process maturity and software project success. We measured process maturity using a CMM rating, and success was measured using cost and schedule indicators. First, we provide an introduction to the concepts and definitions we used in our work. Then, we provide details of our methodology, that describe our approach. Finally, we provide the details of our analysis, then summarize our results.
The key assumption is that there is a significant positive correlation between the SEI CMM rating and the success of the software development. Although the concept of "success" in terms of software development has many definitions, a consistent theme found in software engineering literature is that success can be measured as a combination of cost, schedule, and quality performance It is important to note that all of the data points had CMM ratings of 1,2, and 3. It is still highly unusual to find organizations with higher ratings, so these represent the expected data values. However, it means that our research findings are only valid for these three CMM levels.
CMM rating data is at best ordinal in nature. Hence, statistical analysis techniques such as multiple linear regression, which require interval or ratio data, cannot be rigorously applied. However, a combination of descriptive and nonparametric techniques are adequate to establish the presence or absence of a statistically significant correlation of software process maturity and software development success. Scatter plots are used to visualize data by plotting two elements of each data point. Box and whiskers plots show similar data except that they indicate data groupings by a box and outliers by "whiskers," rather than plotting each individual point. For our analysis we used plots of CPI vs. CMM rating as well as SPI vs. CMM rating.
In project management, the Cost Performance Index (CPI) and the Schedule Performance Index (SPI) are the standard indices in use. Actual Cost of Work Performed (ACWP) is the sum of funds actually expended in the accomplishment of the planned work tasks. The Budgeted Cost of Work Performed (BCWP) represents the earned value of the work performed and is an estimate of the value of the work completed. Deviations in the actual vs. planned cost can be expressed in the ratio of BCWP to ACWP. This is called the Cost Performance Index (CPI). CPI = BCWP/ACWP A CPI of less than 1.00 implies that for every dollar of value earned, more than one dollar was actually spent--a cost overrun. A CPI of more than 1.00 implies that for every dollar of value earned, less than one dollar was spent, and a CPI of 1.00 implies an "on-target" condition.
Similarly, the projected rate of funds expenditure is the Budgeted Cost of Work Scheduled (BCWS), which can be expressed as the planned expenditure of funds over time, based on the completion of the planned work packages. The ratio of BCWP to BCWS defines the degree to which a project is ahead of or behind schedule and is called the Schedule Performance Index (SPI). SPI = BCWP/BCWS An SPI of less than 1.00 implies that for every dollar of work scheduled, less than one dollar has been earned--a schedule overrun. An SPI of more than 1.00 implies that for each dollar of work scheduled, more than one dollar of work has been earned, and an SPI of 1.00 implies an on-target condition.
At Level 1, the central tendency is somewhere below the target, and the distribution exhibits a high variance. At Level 2, the central tendency of the distribution is now on or very near the target, but the distribution still exhibits a high degree of variance. At Level 3 and above, the central tendency of the distribution is the same as the target, and the variance of the distribution decreases as the CMM rating increases
The indices of CPI and SPI are the standard cost and schedule performance measures for both government and industry. The closer the CPI and SPI are to a value of 1.00, the more successful the project can be considered, at least in terms of cost and schedule . This establishes our performance baseline against which we can compare actual performance data.
Very High Relevance - The project under consideration was the sole project evaluated in the CMM rating process.
The Kruskal-Wallis Test is a nonparametric analysis of variance, testing the null hypothesis that samples subjected to different treatments, e.g., CMM ratings, actually belong to the same population. The rejection of the null hypothesis suggests that the populations are different. In our analysis, the rejection of the null hypothesis suggests there is a difference in the median performance of organizations at different maturity levels. The Kruskal-Wallis Test can only determine if at least two of the samples are from different distributions. To determine if there is a statistically significant difference in more than one pair of samples and which samples differ from which others, a multiple comparison test is required. The multiple comparison test compares the absolute values of the differences of the mean ranks between two samples to determine if there is a significant difference in the two samples. It is important to note that the overall level of significance used in multiple comparisons frequently is larger than those ordinarily used in an inference involving a single comparison. Our multiple comparison test was performed at a level of significance of 0.2, which implies an 80 percent level of confidence in the result. This is consistent with recommended values for this type of nonparametric analysis technique [2].
The aim of our research was to determine the nature of a correlation between the CMM rating and software development success. Though success is difficult to measure directly, by using the indicators of cost and schedule performance, we were able to show correlation between CMM rating and the cost and schedule performance of a generally representative sample of historical software development contracts. We observed improved cost and schedule performance with increasing process maturity. Specifically, the least mature organizations were likely to have difficulty adhering to cost and schedule baselines. In contrast, the more mature organizations were likely to have on-baseline cost and schedule performance. This observed correlation was evident in the data set as a whole, but was more evident in the sample which had high to very high rating- to-project relevance. The correlation was more evident in cost performance than in schedule performance. This study has validated a correlation between project success and CMM ratings established in the same time frame as the project development.Although this result suggests that CMM ratings might be used as a predictor of future project success, more research is required before such a predictive relationship can be established.
Cautions About Interpreting Correlational Results • Need to aware of whether you are attempting to corroborate an association or a casual relationship. • For example, there is a significant correlation between the number of storks in Scandinavia and the human population. However, we do not believe that killing storks will reduce human population level, because the relationship is associative not causal. • Correlational is just a sign-post
How Validity and Reliability Affect Correlation Coefficients? • Is only as accurate as the instrument we are using to measure. -> The Budgeted Cost of Work Performed (BCWP) represents the earned value of the work performed and is an estimate of the value of the work completed-> this is wrong or inaccurate • Only can find substantial correlations if both variables are measured with a reasonable degree of validity and reliability.
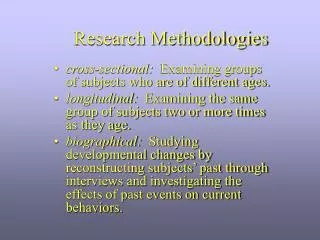
Developmental Designs • How something changes over time (as people grow older) • Cross-sectional - several different age groups • Longitudinal – single group over the course of time
Observation Studies • Focus on a particular aspect of behavior • Each is either counted to determine overall frequency or rated for accuracy, intensity, maturity or some other dimension • Researcher - objective as possible • The versatility of observation makes it an indispensable primary source method and supplement for other methods • In a design we either observe or we communicate
Observations • Nonbehavioral observation • Record analysis – (current financial records, economic data) • Physical condition analysis ( financial condition) • Physical process analysis (time/motion studies of the process) • Behavioral observation – focus an particular aspect and the behavior is quantified – different than qualitative studies
Strengths of Observation • Securing information about people or activities that cannot be derived from experience or surveys (small children) • Avoiding respondent filtering and forgetting (common details are left out and might be just as important like weather, day of the week) • Securing environmental context information • Optimizing the naturalness of the setting • Reducing obtrusiveness
Limits of Observation • Difficulty of waiting long periods to capture phenomena • Expense of observer costs and equipment • The reliability of inferences from surface indicators • The problems of quantification and disproportionately large records • Limitation of present activities and inferences about cognitive processes
Survey Research • Get a better idea of present • Captures a fleeting moment in time • Conjecture – extrapolate over a longer a period of time • When reading survey reports keep in mind that the researcher samples a population at one particular time – nothing is permanent but change
Survey Methods • Face to Face and Telephone Interviews • Questionnaires
Interviews • Make sure your interviewees are representative of the group • Find a suitable location • Take a few minutes to establish rapport • Get written permission • Focus on the actual rather than on the abstract or hypothetical • Don’t put words in people’s mouths • Record responses verbatim • Keep your reactions to yourself • Remember that you are not necessarily getting the facts
Constructing a Questionnaire • Short, simple, unambiguous • Check for implicit assumption • How many cigarettes do you some each day? (This implies that it is the same number each day.) • Do not give clues about desirable responses • What strategies have you tried to quit smoking (May never have tried, but desirable so gives you all kinds that seriously were never tried.) • Check for consistency (have 2 questions especially on socially acceptable answers)
Sampling • Want generalizations – if the sample is truly representative of the population • 2 approaches • Probability • nonprobability
Probability Sampling • The researcher can specify in advance the segment of the population • Random selection – pure chance must dictate choice • Simple random – every member of the population has an equal chance • Stratified random – equally from each of the layers in the population • Cluster – a subset of identified cluster is selected • Systematic sampling – selecting according to a predetermined sequence
Generally homogeneous Contains strata that are approx. equal in size Contains strata that appear in different proportions Contains heterogeneous clusters Simple random sampling Stratified random sampling Proportional stratified random sampling Cluster sampling or systematic sampling of clusters Appropriate Technique
Nonprobability Sampling • Convenience – no pretense of identifying a representative subset of the population, just what’s available • Quota sampling – bases selection upon the same proportions found in general public. • Purposive sampling – choose a combination of a voting districts, in the past elections, quite useful in predicting final outcomes
Sufficient Sample Size • The larger the better • Small populations (less than 100) use entire • Around 500, 50% sampled • Around 1500, 20% sampled • Above, 400 sampled • Also more heterogeneous the population, the larger the sample
Bias in Research Sampling • Bias is any influence, condition, or set of conditions that singly or together distort data • In sampling, example telephone book, selecting from here, the poorest do not have, the richest are not listed • People not listed have a 0% chance of being selected • Mailed questionnaire on IRS audits with only a 30% return rate. These people many not be representative of the original population. ( respondents not wanting to indicate that they have been audited will throw it away.)