Download
1 / 1
10 likes | 97 Views
Learn about the Empirical Observability Score (EOS) in PeptideAtlas builds and its significance in analyzing peptide observability based on LC-MS/MS techniques and protein identification. Explore the PeptideAtlas database and Ensembl Genome Browser to view peptides overlaid on the genome.

E N D
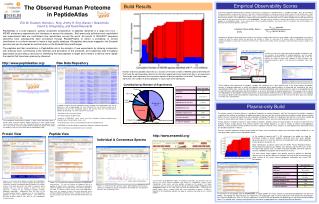
Plasma-only Build Empirical Observability Scores Empirical Observability Score = (EOS) Nsamples(peptide) Nsamples(parent protein) http://www.ensembl.org/ Custom tracks for PeptideAtlas builds are available at Ensembl. Any Ensembl user may click on the [DAS Sources] pulldown and enable the PeptideAtlas and/or Plasma PeptideAtlas custom tracks and view peptides overlayed on the genome. The above screenshot shows an instance of alternative splicing confirmed: peptides PAp00042742 and PAp00038023 begin on the same exon, but finish on different exons. Clicking on the peptide glyphs causes a popup widow with more information to appears, including a hyperlink to the PeptideAtlas peptide view page for complete information on the selected peptide. Build Results The Observed Human Proteome in PeptideAtlas It has been frequently noted that when a protein is observed in a sample that is analyzed with LC – MS/MS techniques, some of the protein’s component peptides are observed many times, while other component peptides are not observed at all, despite being in the observable mass range and otherwise having attributes appropriate for MS analysis. Several algorithms that attempt to predict observability based on sequence attributes have been put forward. These algorithms are often heavily influenced by the data with which they are trained. Peptides that are often observed and map uniquely to only one protein have been called “proteotypic”. We now routinely calculate an empirical observability score, defined below, for all peptides in a PeptideAtlas build. These scores do not rely on prediction algorithms, but merely reflect the frequency with which peptides are observed when the parent protein is observed. Eric W. Deutsch, Nichole L. King, Jimmy K. Eng, Alexey I. Nesvizhskii, David S. Shteynberg, and Ruedi Aebersold PeptideAtlas is a multi-organism, publicly accessible compendium of peptides identified in a large set of LC – MS/MS proteomics experiments and interfaces to access the datasets. Both previously published and unpublished raw experimental data are contributed from researchers around the world. All results of SEQUEST sequence searching have subsequently been processed through PeptideProphet to derive a probability of correct identification in a uniform manner to insure a high quality database. All peptides have been mapped to the Ensembl genome and can be viewed as custom tracks on the Ensembl Genome Browser. The peptides and their annotations in PeptideAtlas aid in the analysis of new experiments by allowing comparison with previous work, contributing to the definition and annotation of the proteome, and supporting high throughput approaches by providing a resource for identifying the best peptides to target and a means to identify more rapidly the spectra that have been previously observed. We define the Empirical Observability Score (EOS) as the number of samples within which the given peptide is observed divided by the number of samples for which the parent protein was observed. For example, if Protein X is observed in 10 samples within a PeptideAtlas build and its component peptide A is observed in 5 of those, the EPS is 0.5. Note that the number of times a peptide is observed within any given sample is not a factor. PeptideAtlas protein view page Cytoscape view of proteins & peptides In order to visualize the relationships between peptides and proteins and the usefulness of the peptides for targeted proteomics, one can export PeptideAtlas information to the Cytoscape visualization tool. At left, the proteins are shown in purple ovals, peptides in blue rectangles, and proteotypic peptides in green. Very often observed peptides have a red border. proteins http://www.peptideatlas.org/ Raw Data Repository Number of distinct peptides observed as a function of the total number of MS/MS spectra identified with P>0.9 and the corresponding statistics for the latest published Human build. Each box is an experiment. Total height (red) represents the cumulative counter of distinct peptides in the build. The blue height represents the number of distinct peptides in each experiment individually. proteotypic peptides Nprot = 1 Nobs > 1 EOS > 0.3 ambiguously mapped peptide Contribution by Number of Experiments Since shotgun-style experiments of complex samples will sometimes miss some proteins due to the large number of peptides present, a targeted experiment in which only peptides contained within specific proteins of interested are selected by the mass spectrometer will be more successful and time efficient. Using the PeptideAtlas web interface one can select a list of peptides based on the EPS score (defined) below and other attributes as an aid in the design of targeted experiments. For example, one can query the PeptideAtlas for the peptides matching constraints: contained within the desired list of target proteins, having EOS > 0.3, mapping to exactly one protein within the proteome, and having an observation count greater than 5. This list can then be used as an inclusion list of the mass spectrometer. 13 other 7 B/T cell 9 cell culture 50 plasma & serum • In addition to making the final PeptideAtlas builds available on the PeptideAtlas web site for browsing as well as downloading, we also redistribute the raw instrument output for all experiments for which the contributors allow it. We currently have over 130 experiments available for download. For each experiment, we provide: • Raw data in native instrument format • Raw data in popular mzXML format • Tarball of all SEQUEST search results and Trans Proteomics Pipeline postprocessing (PeptideProphet, ProteinProphet results, etc.) • Final identification summary (ProteinProphet output) in protXML format • A README text file describing the experiment, protocols, and other information • Links to contributors and publications where available 29 cell line The protein content of human plasma is considered important for medical diagnosis and has the potential to provide a complete snapshot of the health of an individual. In addition to proteins that carry out their function within the circulatory system, plasma contains proteins that are secreted or leaked from cells and organs throughout the body. As a diagnostic tool, plasma is even more valuable by virtue of its accessibility, with millions of samples stored in clinical archives and even more obtained every year from patients. Human plasma is thought to contain a large number of proteins, perhaps nearly all human proteins on account of low-level tissue leakage. Further, human plasma also contains proteins from foreign organisms as well as millions of distinct immunoglobulins. However, a mere 22 proteins make up 99% of the mass of protein in human serum, and thus an investigation of the thousands of very low abundance proteins is difficult. Due to its medical importance and the large number of human serum and plasma samples that have been made available to us, we have generated a special Human PeptideAtlas Build. 2 cancer tissue 6 bronchial lavage The PeptideAtlas web interface provides a simple search box within which a protein name, accession number, peptide sequence, or some fraction thereof can be entered. Search results are returned for specific or any organism. From there, tabs provide a way to navigate between peptide and protein views within the database, and see results within different PeptideAtlas builds. 2 saliva 3 brain tissue Protein View Peptide View As the number of spectra with P > 0.9 assignments are added, we show the cumulative number of distinct peptides observed more than once; peptides observed only once in all of the spectra are exlcuded due to the higher proportion of false positives among this set. Major contributions of spectra come from the HUPO Plasma Proteome Project, Pacific Northwest National Labs (PNNL), NCI, Novartis and the SPC itself. Of the 14 million input spectra, over 1.3 million have been identified, and these coalesce into over 15,000 distinct peptides observed more than once. The most recent trend suggests that despite extensive addition of identified spectra, the list of distinct spectra has flattened. We may be close to covering the major fraction of the human plasma petideome achievable with current MS technologies. Individual & Consensus Spectra Above is a screenshot of the protein view within the PeptideAtlas web interface. The user has entered a protein of interest and is returned a summary of information about the protein, the number of times it has been observed in the build, its sequence, which peptides map to it, and the samples in which it has been observed. Clicking on the constituent peptides provides additional information. Additionally there are links to the Ensembl Genome Browser, allowing users to see PeptideAtlas peptides as tracks in the genome browser. Links within the Ensembl Genome Browser link back to the PeptideAtlas interface as well. Above is a screenshot of the peptide view within the PeptideAtlas web interface. The user has entered (or followed a link to) a peptide of interest and is returned a summary of information about the peptide, the number of times it has been observed in the build, its sequence, which charge states and modifications were seen, the samples in which it has been observed, and a listing of individual identified spectra. Clicking on the spectra in the listing brings up it spectrum, decorated with identified ions (to right). Above is a screenshot of the spectrum viewer. Both individual and consensus spectra are available for viewing (and export). Observed B ions are labeled in red and Y ions are labeled in blue. A screenshot of the peptide view for PAp00094809, a tryptic peptide that maps uniquely to Secreted phosphoprotein 24 precursor (SPP2). The peptide was observed only in 3 experiments, the large-scale, high sensitivity experiments from HUPO, NCI and Novartis. But since this peptide was seen in 3 of the 4 experiments in which SPP2 was detected, the peptide gets a high Empirical Observability Score. This peptide maps uniquely to one protein only and makes a good peptide for a targeted experimental approach.