Download
1 / 14
150 likes | 344 Views
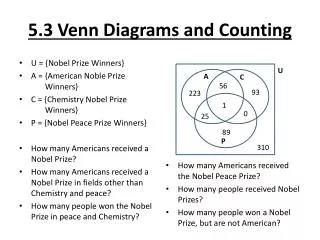
5.3 Venn Diagrams and Counting. Basic Regions Basic Regions and Counting. Basic Regions. Each Venn diagram divides the universal set into non-overlapping regions called basic regions. Example Basic Regions. Show the basic regions for the Venn diagram with two sets and with three sets.

E N D
5.3 Venn Diagrams and Counting • Basic Regions • Basic Regions and Counting
Basic Regions Each Venn diagram divides the universal set into non-overlapping regions called basicregions.
Example Basic Regions • Show the basic regions for the Venn diagram with two sets and with three sets.
Example Basic Regions and Counting For the survey of the presidents of the 500 largest corporations in the US where 310 had degrees (of any sort) in business, 238 had undergraduate degrees in business, and 184 had graduate degrees in business: a. Draw a Venn diagram and determine the number of elements in each basic region; b. Determine the number of presidents having exactly one degree in business.
Example Basic Regions and Counting n(I) = n(U) - n(S T) = 500 - 310 = 190 n(III) = n(ST) = 112 n(II) = n(S) - n(ST) = 238 - 112 = 126 n(IV) = n(T) - n(ST) = 184 - 112 = 72
Example Basic Regions and Counting The number of presidents with exactly one business degree corresponds to the shaded region. Adding the number of people in the two shaded basic regions gives 126 + 72 = 198.
Surveys Problems involving sets of people (or other objects) sometimes require analyzing known information about certain subsets to obtain cardinal numbers of other subsets. The “known information” is often obtained by administering a survey.
Example: Analyzing a Survey Suppose that a group of 140 people were questioned about particular sports that they watch regularly and the following information was produced. 93 like football 40 like football and baseball 70 like baseball 25 like baseball and hockey 40 like hockey 28 like football and hockey 20 like all three a) How many people like only football? b) How many people don’t like any of the sports?
B F 20 H Example: Analyzing a Survey Construct a Venn diagram. Let F = football, B = baseball, and H = hockey. Start with like all 3
B F 20 Subtract to get 20 8 5 H Example: Analyzing a Survey Construct a Venn diagram. Let F = football, B = baseball, and H = hockey.
B F 20 25 Subtract to get 45 20 8 5 7 H Example: Analyzing a Survey Construct a Venn diagram. Let F = football, B = baseball, and H = hockey.
B F 20 25 45 20 8 5 7 10 H Example: Analyzing a Survey Construct a Venn diagram. Let F = football, B = baseball, and H = hockey. Subtract total shown from 140 to get
Analyzing a Survey • Solution • (from the Venn diagram) • a) 45 like only football • 10 do not like any sports
Summary Section 5.3 • The universal set can be divided up into a number of non-overlapping regions called basic regions. These regions can be used to determine the number of elements in a variety of subsets of the universal set.