Download
1 / 26
260 likes | 374 Views
060730 Talk Outline. Air Quality Information System Challenges (5min) Real-time monitoring and data delivery (1 slide) Characterization of pollutant in space/time/parameter (1 slide) Agile (1 slide) Use Cases: (10min) Canada Smoke: Realtime, Science, Regulatory, Public (7min)

E N D
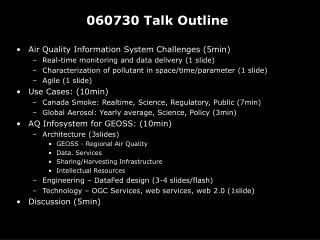
060730 Talk Outline • Air Quality Information System Challenges (5min) • Real-time monitoring and data delivery (1 slide) • Characterization of pollutant in space/time/parameter (1 slide) • Agile (1 slide) • Use Cases: (10min) • Canada Smoke: Realtime, Science, Regulatory, Public (7min) • Global Aerosol: Yearly average, Science, Policy (3min) • AQ Infosystem for GEOSS: (10min) • Architecture (3slides) • GEOSS - Regional Air Quality • Data. Services • Sharing/Harvesting Infrastructure • Intellectual Resources • Engineering – DataFed design (3-4 slides/flash) • Technology – OGC Services, web services, web 2.0 (1slide) • Discussion (5min)
Summary • The current challenges for air quality information systems include delivery of air quality data in real time, characterization of air pollution through the integration of multi-sensory data and providing agile support to regulatory management. The talk describes the architecture and implementation of a standards based system for accessing and processing air quality data. The web services based architecture is illustrated through two use cases: (1) real time monitoring of a smoke event and (2) hemispheric transport of air pollutants.
S. Young Challenge #1:Real-time monitoring & watching for surprises Choose Data & Tools Browse, Explore Trigger Need link to live monitoring console
GEOSS Architecture Mapped to Air QualityThe L. Friedl, K. Fontaine Challenge Special Architectural Features: Implied data assimilation into models Decision Support black box Focus on model predictions, not ‘simulation’ Pollutant ‘Characterization’ is implicit Not part of DataFed Policy, Management, Personal Decisions
Use Case 1: Smoke Event • Place holder for Flash #1: Canada Smoke
GEOSS and National/Regional Air Quality Assessment • The GEOSS global view establishes the larger-scalecontext • Regional perspective focuses on the detailed characterization of local features GEOSS Global Local Air Quality Benefit Global data, tools => Broader context, cost savings Global analysis => Spatial context, Characterization Intellectual Resources => Collaboration, Analysis Regional GEOSS Benefit Local data, tools => Enriched global resource pool Local data analysis => More detail, insights, Intellectual Resources => Collaboration, Analysis • AQ data analysis needs to be performed at both through GEOSS and regional programs • GEOSS Information Architecture needs to support global-regional information exchange.
The Terry Keating Challenges Obs. & Models Decision Support System Control Std. Interface Std. Interface Data Facilitate data-model comparison, assimilation Reports Data Sharing Gen. Processing Domain Processing Reporting Include global perspective (observation, model, analysis)
Use Case 2: Hemispheric Transport • Place holder for Flash #2: Hemispheric Transport
Stages of AQ Data Flow and Value-Adding Processes Obs. & Models Decision Support System Control Std. Interface Std. Interface Data Reports Data Sharing Gen. Processing Domain Processing Reporting Value-Adding Processes Organizing DocumentStructure/FormatBuild Interface Characterizing Display/BrowseCompare/Fuse Characterize Analyzing Filter/IntegrateAggregate/FuseCustom Analysis Reporting Inclusiveness Iterative/Agile Dynamic Report
Information System Components for AQ Programs Obs. & Models Decision Support System Control Std. Interface Std. Interface Data Reports Data Sharing Gen. Processing Domain Processing Reporting Public Machine Information System Human Information System
Flow of Data and Usage Control Flow of Control Reports are commissioned by programs Analysts select, explore, and process data for a report Data providers have generally little control over the end use Obs. & Models Decision Support System Control Std. Interface Std. Interface Data Reports Data Sharing Gen. Processing Domain Processing Reporting Flow of Data Providers expose data to analysts who extract the needed subset The data is pulled into data exploration or processing software Some programs control their own data collection, others do not
Real-time Smoke Event DSS: Data Sources and Decision Support Systems EPA Chemistry NAAQS Exc. Events States: AQ Warning SatTOMS NOAA SatGOES Public Travel Advisories PM25 AQ Forecasting Vis FAA Flight Advisories Mod NASA SatModis Earth Obs: Public
The Network Effect:Less Cost, More Benefits through Data Multi-Use Programs ask/get Data Data Orgs Develop Programs Public sets up Orgs Data Program Data Organization Program Data Re-Use Network Effect Public Program Organization Data Data Program Data Pay only once Richer content Less Prog. Cost More Knowledge Less Soc. Cost More Soc. Benefit Data Reuse Data are costly resource– should be reused (recycled) for multiple applications Datareuse saves $$to programs and allowsricher knowledgecreation Data reuse, likerecycling takes some effort: labeling, organizing, distributing
Monitor Monitor Monitor Monitor Data n Data 1 Data 2 Data m Store Store Store Store Integrated Data3 Integrated Data1 Integrated Data2 Staged Data Integration? Staged portal Virtual Int. Data Oodle! CNet … System integrates foreword from provider to the users So that user can find/monitor content User can navigate backwards toward the provider PoP – harvester Needs work!
VIEWS RPO Federated Information System • Data producers maintain their own workspace and resources (data, reports, comments). • However, part of the resources are shared through a Federated Information System. • Web-based integration of the shared resources can be across several dimensions: Applications Private Shared PM Policy Regulation RPO Data sharing federations: • Open GIS Consortium (GIS data layers) • NASA SEEDS network (Satellite data) • NSF Digital Government • EPA’s National Env. Info Exch. Network. Mitigation RPO Federated Data System Data, Tools, Methods Other Federations Portal ESIP Portal Unidata Portal User communities Data to be “dispersed” to multiple “portals”, each serve different clientele Open architecture allows portals to reconfigure resource collections
Replace cube with standard interface For reusable data flow indicate homogenization for reusability (wrappers)
DataFed Explanation • Place holder for Flash #3: DataFed – Catalog, Viewer, Service Flow
“Core” Air Quality Information Network • Consists of limited number of stable nodes • Provides core functionality • Members are eager network participants. • Well connected; value through compound services. • Network robustness arises from redundancy, practice,… Candidate Nodes: EPA: AIRS, AirNOW, VIEWS NOAA: NCDC, HMS NASA: OnEarth, INTEX Model Other: Unidata
Loosely Coupled Data Access through Standard Protocols Obs. & Models Decision Support System Control Std. Interface Std. Interface Data Reports Data Sharing Gen. Processing Domain Processing Reporting Server GetCapabilities Client Std. Interface Std. Interface Capabilities, ‘Profile’ Client request Capabilities Server returns Capabilities and data ‘Profile’ Client requests data by ‘where, when, what’ query Server returns data ‘cube’ in requested format Back End Where? When? What? Which Format? Front End GetData Data T1 T2
Service Chaining & Workflow Web Services and Workflow for Loose Coupling Obs. & Models Decision Support System Control Std. Interface Std. Interface Data Reports Data Sharing Gen. Processing Domain Processing Reporting Web Service Interaction Service Broker Find Publish Bind Service User Service Provider Web Services Triad:Publish – Find – Bind Workflow Software:Dynamic Programming
Co Writing - Wiki ScreenCast Collaborative Reporting and Dynamic Delivery Obs. & Models Decision Support System Control Std. Interface Std. Interface Data Reports Data Sharing Gen. Processing Domain Processing Reporting Analysis Reports: Information supplied by manyNeeds continuous program feedbackReport needs many authorsWiki technologies are for collaborative writing Dynamic Delivery: Much of the content is dynamicAnimated presentations are compellingMovies and screencasts are for dynamic delivery