Download
1 / 39
440 likes | 600 Views
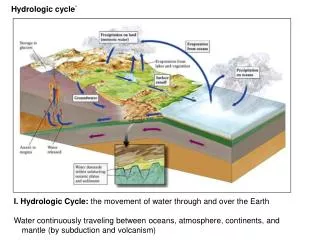
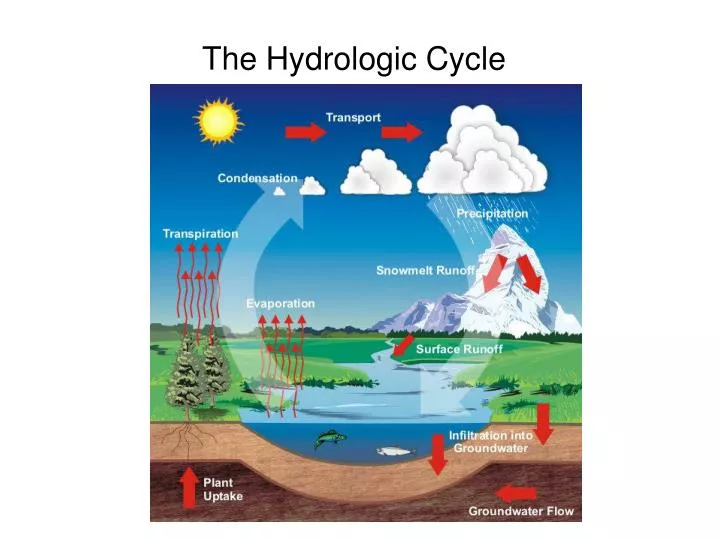
The Hydrologic Cycle. Salt water vs. fresh water. In this class, we will be mostly Concerned with fresh water (terrestrial). Less than 1% of the Earth’s freshwater is on the surface at any time. 20% of the freshwater flows through the ground – groundwater.

E N D
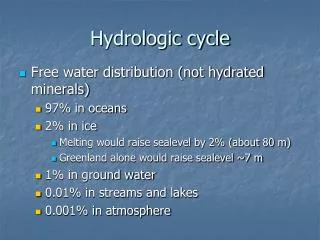
Salt water vs. fresh water In this class, we will be mostly Concerned with fresh water (terrestrial).
Less than 1% of the Earth’s freshwater is on the surface at any time. • 20% of the freshwater flows through the ground – groundwater. http://www.jhuccp.org/pr/m14/m14figs.stm
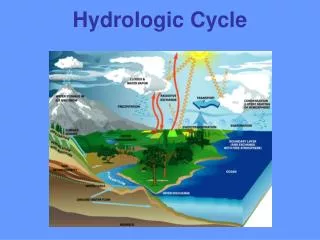
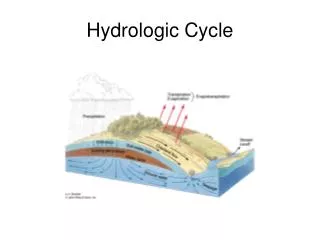
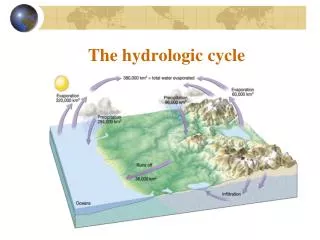
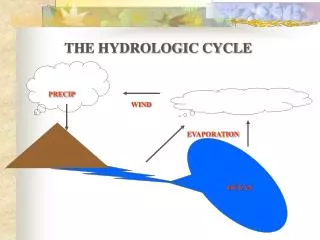
Precipitation Evaporation Evaporation Evaporation (ET) Ocean Infiltration runoff Aquifer Precipitation Evaporation/ET Surface Water Groundwater Basic Cycle
Water Residence Times Get this image from the mac to place here http://www.unep.org/vitalwater/05.htm
Stream:body of running water that is confined to a channel and moves downhill due to gravity
Drainage Basin:total area drained by a stream. Larger streams have larger drainage basins. The size and composition of the sediment carried by the stream depends on the nature of the drainage basin.
Suspended Load Dissolved Load Bed Load
Straight Channel Meandering Channel Braided Channel
Braided Streams Streams with high sediment loads deposit lots of channel bars. The stream moves around the bars, finding its way through the barriers. Usually found near sediment source areas and/or areas with easily eroded substrate. Fig. 10.18
Deposition occurs on point bars, where stream velocity is low Erosion occurs on cutbanks, where stream velocity is high Meandering Stream Fig. 10.06
Deposition occurs on point bars, where stream velocity is low Erosion occurs on cutbanks, where stream velocity is high Meandering Stream Fig. 10.06
Meandering Streams oxbow lake Fig. 10.24
Flood Plain: area habitually flooded by a stream at high water. Contains fine-grain sediment deposited during flooding Natural levee: low ridges formed along sides of main stream channel during flooding. Fig. 10.27
Flood Plain: area habitually flooded by a stream at high water. Contains fine-grain sediment deposited during flooding Natural levee: low ridges formed along sides of main stream channel during flooding. Fig. 10.27
Stream Budget Water In (Inflow) Water Out (Outflow) Discharge from upstream Rate (slope-dependent) Surface runoff Capacity (shape-dependent) Groundwater influx Direct precipitation 150 m 93 m I <=> O normally I > O channel fills If channel fills completely, river can overflow banks and flood
Flooding at River Park, Rock Hill September, 2004 Flooding along the Catawba river was caused by extreme rainfall resulting from an unusual series of powerful hurricanes and tropical storms.
Precipitation – the basic water resource GW GW GW GW GW Adapted from: GWP (M. Falkenmark), 2003, Water Management and Ecosystems: Living with Change Blue & Green Water - perspective
Why so much for agriculture? • Most countries want/need to feed themselves. • No water = no plants = no food
Photosynthesis 6CO2 + 6H2O C6H12O6 + O2 • C3 plants – 1 gram biomass per 650-800 grams water transpired • C4 plants – 1 gram biomass per 250-350 grams water transpired • CAM plants – 1 gram biomass per 100-200 grams water transpired
Water use and farms • Average water needed per acre of crop • Soybean (C3 plant) = 737,100 liters H2O • Corn (C4 plant) = 862,500 liters H2O Considering that many farms are hundreds to thousands of acres…that’s a lot of water!! ---Note that corn is a more massive crop. ---Also note that CAM plants are primarily habit the desert and are not irrigated.
Typical Domestic Water Use • 10 – 40 L/person/day (water scarce) • 50 – 100 L/person/day (low-income) • 100 – 600 L/person/day (high-income) • Differences in domestic freshwater use: • Piped or carried • Number/type of • appliances and sanitation
Water Stress Index • Based on human consumption and linked to population growth • Domestic requirement: • 3.65 - 14.6 m3/person/year (water scarce) • 36.5 - 219 m3/person/year (high-income) • Associated agricultural, industrial & energy need: • 20 x domestic requirement • 73 – 292 m3/person/year • 730 – 4380 m3/person/year • Total need: • 77 – 307 m3/person/year (water scarce) • 767 – 4599 m3/person/year (high-income)
Water Stress per International River Basin http://www.transboundarywaters.orst.edu
Colorado River Basin http://www.crwua.org/ • Colorado River water usage • Water “rights” from river (in million acre feet) • Colorado 3.85 • New Mexico 0.84 • California 4.4 • Arizona 2.8 • Nevada 0.3 • Utah 1.7 • Mexico 1.5 Total 15.39 Average River Flow = 15.5