Download

1 / 24
240 likes | 351 Views
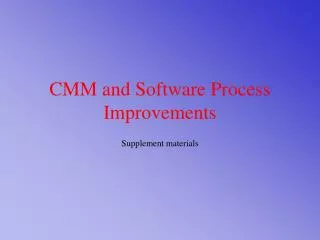
This document outlines the advancements in control rod calibration processes at Kansas State University, particularly focusing on improving excess reactivity shutdown margins. It details calibration methods such as Positive Period and Rod Drop, emphasizing their accuracy and effectiveness for varying reactivity limits. The process includes collecting data through Virtual Instrument (VI) systems, analyzing data in Excel, and addressing potential challenges such as data collection time and human factors. Key techniques for enhancing accuracy, including MATLAB solutions and sensitivity evaluations, are also discussed.

E N D
Process Improvements inControl Rod Calibrations P. M. Whaley Kansas State University
Excess reactivity Shutdown margin (reactive rod out) React. Addition Rate Pulse rod worth $2.50 $1.10 $0.087/s $2.00 (nominal) Reactivity Limits
Calibration methods • Positive Period • More accurate in differential worth • More likely to propagate in integral worth • Rod Drop • Accuracy satisfactory for additions < $2.00 • K-State uses either: • Both methods covering full scale, or • Verification of worth if rods > $2.00 full out
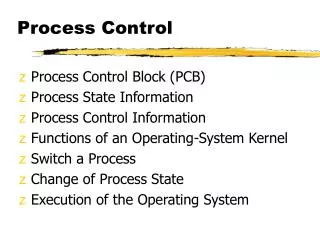
Calibration PROCESS Critical START Program Drop Rod • DAC collection • Coordinate manually • Coordinate in a VI • 6-second buffer loop Collect Data Write data to file (3) VI Senses Rod Drop (4) Stores Buffer & Subsequent Data STOP VI
Calibration PROCESS (2) Import to Excel Find Drop Normalize to pre-drop average Time Scale Select & plot points Average & Error analysis Extrapolate
Issues & Problems • Time • Analysis • Days to collect data • Followed by days to analyze data • Identifying erroneous data • Anomalous data cannot be corrected real-time • Human factors not optimal in the process • Plotting • Extrapolating • It’s going to get worse
Data Collection Critical START VI Drop Rod VI notes stability VI records continuously Write data to file VI Collects Data STOP recording
Pre-Analysis Specify File Find Drop Select Tolerance Normalize to pre-drop average Option Manual
Analysis Specify Analysis Start & Stop Interpolate Data Calculate Mean & Standard Dev
Matrix • Power fractions, ASCI II files Time Reactivity Fraction • Differential equations for inhour equation • Matlab solution • Parameters from Hazard Summary Report
For the Future • Evaluate sensitivity of measurement • Current measurements are satisfactory • HSR method uses β vice β-effective • HSR method uses l for aluminum fuel vice SS • Any changes subject to 10CFR50.59 • Measure kinetics parameters • White noise experiments • Pile oscillator • Determine if adjustments can be made to improve accuracy for large reactivity additions
Acknowledgement SMART Laboratory Personnel • Tyler Krehbiel (LabView Programming) • Mark Harrison (Calculations)