Download
1 / 19
280 likes | 887 Views
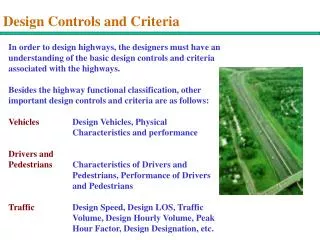
Design Controls and Criteria. In order to design highways, the designers must have an understanding of the basic design controls and criteria associated with the highways. Besides the highway functional classification, other important design controls and criteria are as follows:

E N D
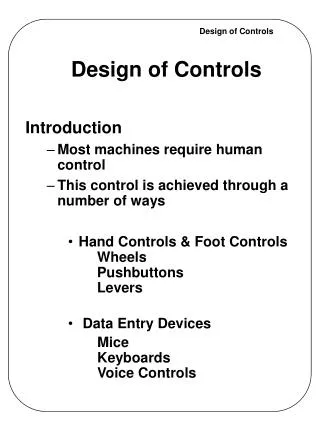
Design Controls and Criteria In order to design highways, the designers must have an understanding of the basic design controls and criteria associated with the highways. Besides the highway functional classification, other important design controls and criteria are as follows: Vehicles Design Vehicles, Physical Characteristics and performance Drivers and Pedestrians Characteristics of Drivers and Pedestrians, Performance of Drivers and Pedestrians Traffic Design Speed, Design LOS, Traffic Volume, Design Hourly Volume, Peak Hour Factor, Design Designation, etc.
Design Controls Design Features Functional Classification Traffic Data Terrain Locale Design Speed Lane width, rural X X X Lane width, urban X X Rural shoulder width, type X X Urban shoulder width, type X X Guard Rail offset X X Degree of curve X Grades X X X Bridge clearances (horizontal & vertical) X X Stopping sight distance X Superelevation X Widening on curves X Rural design speeds X X X Urban design speeds X X Design Controls and Design Features
Design Vehicles • Key controls in geometric design are the physical characteristics and proportions of vehicles of various sizes using the highway. • Design vehicles are the selected vehicles with representative weight, dimensions, and operating characteristics used to establish highway design controls for accommodating vehicles of designated classes. • Each design vehicle has larger physical dimensions and a larger minimum turning radius than most vehicles in that class. The largest design vehicles are usually accommodated in freeway design. • There are 19 not 15 design vehicles in four groups of design vehicles: Passenger Cars, Buses, Trucks, and Recreational Vehicles. • Bicycle is considered as a design vehicle where it is allowed on a highway.
Design Vehicles These 19 design vehicles are: 1. Passenger Car (P) 2. Single Unit Truck (SU) 3. Intercity Bus (Motor Coaches) (BUS-12, BUS-14) 4. City Transit Bus (CITY-BUS) 5. Conventional School Bus (65 passengers) (S-BUS 11) 6. Large School Bus (84 passengers) (S-BUS 12) 7. Articulated Bus (A-BUS) 8. Intermediate Semitrailer (WB-12) 9.Intermediate Semitrailer (WB-15) 10. Interstate Semitrailer (WB-19) 11. Interstate Semitrailer (WB-20) 12. Double-Bottom-Semitrailer/Trailer (WB-20D) 13. Triple Semitrailer/Trailers (WB-30T) 14. Turnpike Double-Semitrailer/Trailer (WB-33D) 15. Motor Home (MH) 16. Car and Camper Trailer (P/T) 17. Car and Boat Trailer (P/B) 18. Motor Home and Boat Trailer (MH/B) 19. Farm Tractor (TR)
Selecting a Design Vehicle in Design Designers should consider the largest design vehicle likely to use that facility with considerable frequency or a design vehicle with special characteristics appropriate to a particular intersection in determining the design of such critical features as radii at intersections and radii or turning roadways. Passenger Car (P) A parking lot or a series of parking lots. Single Unit Truck (U) Intersections on residential streets and park roads CITY-BUS State highway intersections with city streets designated as bus routes and having relatively few large trucks using them S-BUS 11 or S-BUS 12 Intersections of highways with low volume county highways and township/local roads < 400ADT, and intersections on subdivision streets. WB-20 (WB-65 or 67) Intersections of freeway ramp terminals with arterial crossroads and intersections on state highways and industrialized streets that carry high volumes of traffic and/or that provide local access for large trucks.
Minimum Turning Paths of Design Vehicles • Primary dimensions affecting design are minimum centerline turning radius (CTR), out-to-out track width, the wheelbase, and the path of the inner rear tire. See Exhibit 2-2 for Minimum Turning Radii of design vehicles. • Turning speed is assumed to be15 km/h or 10 mph. • Examine Exhibit 2-3 to 2-23 for 19 design vehicles. No minimum turning paths are provided for farm tractor in Green Book. • Minimum turning paths are shown in scale. The boundaries of the turning paths of each design vehicle for its sharpest turns are set up by the outer trace of the front overhang and the path of the inner rear wheel. • An intersection should be assessed its allowable turning paths against the minimum turning paths of the design vehicle. A commercial program such as AutoTURN is often used for such assessment.
Vehicle Performance • Acceleration and deceleration rates of vehicles are often the critical parameters in determining highway design for intersections, freeway ramps, climbing or passing lanes, and turnout bays for buses. • Pay attention to acceleration and deceleration rates used in calculating Stopping Sight Distances and other design control factors.
Driver Performance • Designers should consider driver performance in their geometric design. • A transportation-based human factor theory is critical in guiding designers to understand drivers’ needs when they drive on roads. • Performance of different age groups are different. Older drivers have special needs, for example, more response time in detecting and digesting traffic information. • Each driver when driving will handle three types of information: Control (steering and speed control), Guidance (lane placement, road following, and car-following), and Navigation (trip planning).
Driver Performance and Design Information Type Design Consideration Control Steering Turning Radius Speed Control Lane Width Guidance Road-Following Alignments Car-Following Cross Sections Passing Maneuvers Signs and Striping Navigation Origins and Destinations Message Signs Traveler Information System Driver Errors Driver Deficiencies Roadside Design Information overflow Speed 3-D Drive Through (see www.stm-usa.com)
Traffic Characteristics • Design of a highway and its features should be based on explicit consideration of the traffic volumes, design speed, and traffic-related characteristics to be served. • Traffic volume indicates the need for the improvement and directly affect the geometric design features, such as number of lanes, widths, alignments, and grades. • Design speed is the factor that should be carefully considered after the functional classification of the highway to be designed is defined and the future traffic volumes on the highway are projected.
Traffic Volume Review Average Daily Traffic (ADT) Peak Hour Traffic and PHF Design Hourly Volume (DHV) K Factor D and DDHV Composition of Traffic Future Traffic Projection Time Period Vehicles Rate of Flow 6:00 – 6:15 6:15 – 6:30 6:30 – 6:45 6:45 – 7:00 Total 500 575 500 435 2000 2000 veh/h 2300 veh/h 2000 veh/h 1700 veh/h
Design Speed • Design Speed is a selected speed used to determine the various geometric design features of the roadway. • Normally design speed is controlled by the functional classification of highway, adjacent land use, topography, and expected operating speed. • Once the design speed is selected, all of the pertinent highway features should be related to it to obtain a balanced design. • Design speed is ranged from 20 – 120 km/h and can be selected in increments of 10 km/h. Possible speeds can be 20, 30, 40 ,,, 130 km/h • Post Speed, Design Speed, Operating Speed
Traffic Flow Relationships • Traffic Density, Flow Rate and Speed are inter-related. • Density is the number of vehicles per unit length of roadway and is used as the measure of quality of traffic service for freeways and multilane highways. • Flow rate (or traffic volume) varies with density from zero to maximum flow rate. Two points of zeros with different speed indicate either no vehicles or too many vehicles on the roadway that flow has stopped. Maximum flow is reached at the point of maximum density. See Exhibit 2-30.
Capacity • Capacity is the maximum hourly rate at which persons or vehicles can reasonably be expected to traverse a point during a given time under prevailing roadway and traffic conditions. • Each highway facility has its own capacity in handling persons or vehicles. Highway Capacity Analysis is often done using Highway Capacity Manual for three purposes: Transportation planning studies to assess the adequacy or sufficient of an existing facility or an highway network to serve current traffic Highway design to select highway type and number of lanes Traffic operational analysis to identify bottleneck locations
Capacity and Highway Design Design Volume Traffic Volume projected to use a particular facility during the design year Design Service Flow Rate Maximum hourly rate of traffic that a highway with particular design features would be able to serve without the degree of congestion failing below a pre-selected level. Measure of Congestion Uninterrupted Traffic Flow Density is the measure for the degree of congestion Interrupted Average stopped time delay - signalized intersection Traffic Flow Accepted Degrees of Congestion See five principles on Page 78-79.
Level of Service and Design LOS Level of Service See Page 84 for the definitions of levels of service from A to F Design LOS See Page 85 for the design LOSs for different areas and terrain types. Design Service Flow Rates Once a design level of service has been identified as applicable for design, the corresponding service flow rate logically becomes the design service flow rate.
Pedestrians and Pedestrian Facilities • Interactions of pedestrians with traffic are a major consideration in highway planning and design. • Pedestrian facilities normally include Sidewalks, crosswalks, traffic control measures, curb cuts (depressed curbs and ramped sidewalks) and ramps for the elder walkers and persons with mobility impairments Bus stops or other loading areas, sidewalks on grade separation, stairs, elevators, escalators related to highways • Pedestrian facilities have their own capacity. Sidewalks are measured based on the available area per person. Others are defined in the AASHTO Guide for the planning, Design and Operation of Pedestrian Facilities.
Pedestrians Characteristics • Pedestrians most likely will not walk over 1.5 km to work or over 1.0 km to catch a bus, and about 80 % of the distances traveled by the pedestrians will be less than 1.0 km. • Pedestrians tend to walk in a path representing the shortest distance between two points. • Pedestrians have a basic resistance to changes in grade or elevation when crossing roadways and tend to avoid using special underpass or overpass pedestrian facilities. • Walking speed varies among walking population. MUTCD uses 4.0 f/s or 1.2 m/s. Now it is changed to 3.0 f/s.
Bicycle and Bicycle Facilities • Bicycle has become an important element for consideration in the highway design process since ISTEA passed in 1991. • Bicycle design should follow Caltrans Chapter 1000. ASSHTO Guide for Development of Bicycle Facilities is a useful reference. More discussion will be provided in the “Design of Bicycle and Pedestrian Facilities” offered to Caltrans engineers. • More information, see http://www.walkinginfo.org and http://www.bikeinfo.org