Download
1 / 27
270 likes | 515 Views
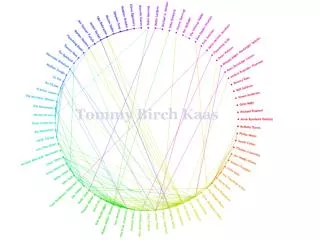
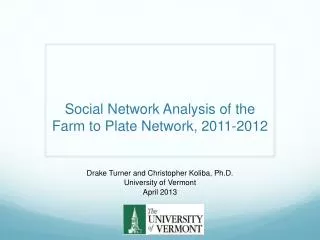
Social Network Analysis of the Farm to Plate Network, 2011-2012. Drake Turner and Christopher Koliba, Ph.D. University of Vermont April 2013. Research Objective. How is the Farm to Plate Network structured? Does this structure create value for member organizations?.

E N D
Social Network Analysis of the Farm to Plate Network, 2011-2012 Drake Turner and Christopher Koliba, Ph.D. University of Vermont April 2013
Research Objective • How is the Farm to Plate Network structured? • Does this structure create value for member organizations? Funded through the James M. Jeffords Policy Research Center
Network Analysis and Food Systems • How is network analysis applied to the food system? • Biology – study of food chains • …and not much else ? = +
Research Question and Hypotheses • RQ – How is the Farm to Plate Network structured on a governance level? How is it structured on an operational level? How do these structures compare to one another? • H1 – The Farm to Plate Network increases and strengthens the connectivity of member organizations in the farm and food sector in Vermont. • H2 – Farm to Plate Network member organizations tend to favor the exchange of information over the exchange of human resources in service of joint programs and projects and the exchange of financial resources. • H3 – Government organizations, nonprofits, and academic organizations participate in the governing and operation of the Farm to Plate Network more centrally than for-profit or funder organizations.
Methods • Online Survey • Sent to representatives from all organizations in total network (212 organizations) • 16 Questions about: • Organization demographics • Association with Farm to Plate Goals • Assessment of impacts of network membership • Collaboration with other network members • Information Sharing, Project/Program Collaboration, Resource Sharing • 85 organizations responded • SPSS • Demographic information, goals, and assessment of impacts • Crosstabs and frequency statistics • ORA/UCINET • Governing network – meeting minutes • Operational network – collaboration data from survey • Network maps and centrality measures
Results • H1 – The Farm to Plate Network increases and strengthens the connectivity of member organizations in the farm and food sector in Vermont. “Our organization has formed new relationships in the past year as a direct result of our involvement in the Farm to Plate Network.” (n=85)
“Our organization’s involvement in the Farm to Plate Network has helped strengthen our existing relationships.” (n=85) “The Farm to Plate Network is helping our organization to advance our organization’s own goals.” (n=85)
Social Network Analysis Terms • Node • Tie • Density • Centrality • Degree • Betweenness • Eigenvector
F2P Governing Network • Governing Network – Number of Meetings Attended by Sector (n=142) • Governing Network – Number of Meetings Attended by Organization (n=142)
Results • Sampled Network – Network Level Measures
Discussion: • Limitations • Missing data • Response validity • Calls for Future Research • Baseline study • Implications for Practice • Network Managers • Network Members • Outsiders
Next steps: • Generate peer review articles • Issue a final report to F2P Network summarizing these findings • Link survey results to Atlas • Continue to analyze data, particularly around goal-specific network configurations. • Possibly continue to provide information back to the F2P network • Conduct network survey every two years to track the evolution of the network over time • Access data from the Atlas to develop a data analytics profile of website users– connecting these results to network analysis– in collaboration with VSJF and others…
Sources • Campbell, M.C. (2004). Building a common table: the role for planning in community food systems. Journal of Planning Education and Research, 23: 341-355. • Clancy, K. (2004). Potential contributions of planning to community food systems. Journal of Planning Education and Research, 23 (4): 435-438. • Farm to Plate Annual Report, 2011. • Farm to Plate Annual Report, 2012. • Kania, J., and Kramer, M. (2011). Collective impact. Stanford Social Innovation Review, Winter 2011: 36-41. • Koliba, C., Campbell, E., and Davis. (2011). Food System Diagram. • Koliba, C., Meek, J., and Zia, A. (2011). Governance Networks in Public Administration and Public Policy. Boca Raton: CRC Press. • Prell, C. (2012). Social Network Analysis: history, theory, and methodology. London: Sage Publications.