Download
1 / 1
10 likes | 106 Views
Presenting a method based on nearest-neighbors for SNP detection on microarrays, producing comparable results to statistical methods with minimal parameter tuning.

E N D
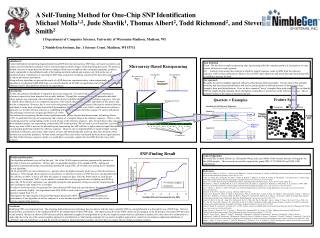
= Conformer = Non-Conformer C N (complement of) Reference Sequence: AAGCATATATCCATCCTAGCATACGATCTTTATACTTAC… C C Probably Bad Data N C C C A Likely SNP Quartet 1: AAGCATATATCCATCCTAGCATACG Probe 1A AAGCATATATCCCTCCTAGCATACG Probe 1C AAGCATATATCCGTCCTAGCATACG Probe 1G AAGCATATATCCTTCCTAGCATACG Probe 1T C C C C C C N N C N C C N C Reference Probes C N N C C C N C N N C C N C C N C A G T A G T C G T A G T A C T A C T A C G N C N N C C C C C A C G G T N N C N C N C C N C C C N C Quartet 2: AGCATATATCCAACCTAGCATACGA Probe 2A AGCATATATCCACCCTAGCATACGA Probe 2C AGCATATATCCAGCCTAGCATACGA Probe 2G AGCATATATCCATCCTAGCATACGA Probe 2T N C C N C C N N C ABSTRACT Current methods for interpreting oligonucleotide-based SNP-detection microarrays, SNP chips, are based on statistics and require extensive parameter tuning as well as extremely high-resolution images of the chip being processed. We present a method, based on a simple data-classification technique called nearest-neighbors that, on haploid organisms, produces results comparable to the published results of the leading statistical methods and requires very little in the way of parameter tuning. Furthermore, it can interpret SNP chips using lower-resolution scanners of the type more typically used in current microarray experiments. Along with our algorithm, we present the results of a SNP-detection experiment where, when independently applying this algorithm to six identical SARS SNP chips, we correctly identify all 24 SNPs in a particular strain of the SARS virus, with between 6 and 13 false positives across the six experiments. N C N C C C … … … Task definition Given: The data from a single resequencing chip, representing either the complete genome of an organism, or some regions of interest in such a genome. Do: Identify, from among the positions at which the sample sequence seems to differ from the reference sequence, which of these positions are likely to be real SNPs rather than noise and return these positions along with a confidence measure for each. Introduction To date, the genomes of hundreds of organisms have been sequenced. For each of these organisms, a consensus or reference sequence has been deposited into a public database. Though this sequence matches the particular individual whose genome was sequenced, other individuals of this species will differ slightly from this reference sequence. One way to identify these differences is to completely sequence, from scratch, the genomes of other individuals of this species and then do a comparison. However, this is very costly and generally impractical. Since most of the genetic variation between individuals is in the form of Single Nucleotide Polymorphisms (SNPs; Altshuler et al., 2000), a much more cost-effective approach is to use the reference sequence as scaffolding and identify variations from this sequence in various individuals. This technique is known as resequencing (Saiki et al. 1989). One method of resequencing that has shown significant results utilizes oligonucleotide microarray technology (Hacia, 1999). In particular, this type of resequencing chip consists of a complete tiling of the reference sequence – that is, a chip containing one probe corresponding exactly to each 29-mer in the reference sequence – plus, for each base in this sequence, three mismatch probes: one representing each possible SNP at this position (We call such a set of four probes a quartet). In theory, any time a SNP is present, the mismatch probe representing this SNP will have a higher intensity signal than the corresponding probe that matches the reference sequence. However, due to unpredictability in signal strength, varying hybridization efficiency, and various other sources of noise, this method typically results in many base positions whose identities are incorrectly predicted. In other words, among all the cases where a mismatch probe has more signal intensity than that of the reference sequence’s probe, we would like to accurately separate the true SNPs from the noisy, false positives. Quartets = Examples Feature Space Our approach We apply the nearest-neighbor approach without needing human-labeled examples. Our key idea is that examples involving bad microarray hybridizations will tend to group together in different portions of feature space than examples from good hybridizations. Once we have separated “noisy” examples from good examples, we can identify SNPs by simply finding examples where the highest-scoring base is not the base in the reference sequence. This is possible because of the nature of our particular task. Microarray-Based Resequencing Target DNA Perfect Match Probe Resequencing Probes Stringent Hybridization Array Image Detail SNP-Finding Result Acknowledgements We would like to thank Edison Liu, Christopher Wong, and Lance Miller of the Genome Institute of Singapore for the SARS samples. This research was partially supported by grants NIH 5 T32 GM08349 and NLM 1 R01 LM07050-01. Results and Discussion Our algorithm performed very well on this task. Out of the 24,900 sequence positions represented by quartets on this chip, 442 are non-conformers. Of these 442, our algorithm identifies 36 as candidate SNPs. Subsequent laboratory experimentation that we performed identified 24 actual SNPs, all of which were among the 36 identified by our algorithm. All 24 actual SNP’s are non-conformers (i.e., quartets where the highest-intensity probe was not from the reference sequence). Note, though, that in general it is possible for a conformer to truly be a SNP; however, our algorithm will not call these as SNPs, at best it will label this quartet as suspicious data. Since the SARS strain we used did not contain any “conforming” SNP’s, we are unable to evaluate how well our approach does at labeling such SNPs as non-calls. Of the 24,458 conformers, our algorithm (using the same parameter settings as used for categorizing the non-conformers) only marked 3% as bad data. In order to verify this result, we generated five more identical SNP chips and exposed them to the same sample. The results varied only slightly. Our algorithm found all 24 SNPs in each of the five cases. The number of false positives ranged from 6 to 13. The figure to the right contains a Receiver-Operating-Characteristic (ROC) curve that further illustrates the performance of our algorithm, as well as compares it to our baseline algorithm. A ROC curve is a plot of true positives against false positives. References Altshuler, D.,Pollara, V., Cowles, C., Van Etten, W., Baldwin, J., Linton, L. & Lander, E., (2000). An SNP Map of the Human Genome Generated by Reduced Representation Shotgun Sequencing.Nature 407:513-516. Cutler, D., Zwick, M., Carrasquillo, M., Yohn, C, Tobin, P., Kashuk, C, Mathews, D., Shah, N., Eichler, E., Warrington, J., & Chakravarti1, A. (2001). High-Throughput Variation Detection and Genotyping Using Microarrays. Genome Research 11:1913-1925. Hacia, J. G. (1999). Resequencing and Mutational Analysis using Oligonucleotide Microarrays. Nature Genetics 21(1 Suppl):42-7. Hirschhorn, J., Sklar, P., Lindblad-Toh, K., Lim, Y., Ruiz-Gutierrez, M., Bolk, S., Langhorst, B., Schaffner, S., Winchester, E., & Lander, E. (2000). SBE-TAGS: An array-based method for efficient single-nucleotide polymorphism genotyping. Proc. Natl. Acad. Sci. 97:12164–12169. Liu, T., Moore A., & Gray, A. (2003). Efficient exact k-NN and nonparametric classification in high dimensions. Proceedings of Neural Information Processing Systems. Mitchell, T. M. (1997). Machine Learning. McGraw-Hill, New York. Nuwaysir, E., Huang, W., Albert, T., Singh, J., Nuwaysir, K., Pitas, A., Richmond, T., Gorski, T, Berg, J. P., Ballin, J., McCormick, M., Norton, J., Pollock, T., Sumwalt, T., Butcher, L., Porter, D., Molla, M., Hall, C., Blattner, F., Sussman, M., Wallace, R., Cerrina, F., & Green, R. (2002). Gene Expression Analysis Using Oligonucleotide Arrays Produced by Maskless Photolithography.Genome Research 12:1749-1755. Ruan, Y.J., Wei, C.L., Ee, A.L., Vega, V.B., Thoreau, H., Su, S.T., Chia, J.M., Ng, P., Chiu, K.P., Lim, L., Zhang, T., Peng, C.K., Lin, E.O., Lee, N.M., Yee, S.L., Ng, L.F., Chee, R.E., Stanton, L.W., Long, P.M., & Liu. E.T., (2003). Comparative Full-Length Genome Sequence Analysis of 14 SARS Coronavirus Isolates and Common Mutations Associated with Putative Origins of Infection. Lancet 361:1779-1785. Saiki, R., Walsh, P., Levenson, C. & Erlich, H. A., (1989). Genetic Analysis of Amplified DNA with Immobilized Sequence-Specific Oligonucleotide Probes. Proc. Natl. Acad. Sci. USA 86:6230-6234 Singh-Gasson, S., Green, R., Yue, Y., Nelson, C., Blattner, F.R., Sussman, M.R., & Cerrina, F. (1999). Maskless Fabrication of Light-Directed Oligonucleotide Microarrays using a Digital Micromirror Array. Nature Biotechnology. 17,:974-978. Wang,D., Fan,J., Siao,C., Berno,A., Young,P., Sapolsky,R., Ghandour,G., Preking,N., Winchester,E., Spencer,J., Kruglyak,L., Stein,L., Hsie,L., Topaloglou,T.,Hubbell,E., Robinson,E., Mittmann,M., Morris,M., Shen,N., Kilburn,D., Rioux,J., Nusbaum,C., Rozen,S., Hudson,T., Lipshutz,R., Chee,M., & Lander,E.(1998) Large-Scale Identification, Mapping, and Genotyping of Single-Nucleotide Polymorphisms in the Human Genome Science280:1077-1082. Wong C., Albert, T., Vega V., Norton, J., Cutler D., Richmond, T., Stanton, L., Liu, E. & Miller, L. (2004). Tracking the Evolution of the SARS Coronavirus Using High-Throughput, High-Density Resequencing Arrays.Genome Research, accepted for publication. Called Bases Conclusion Identifying SNPs is an important task. The emerging field of microarray technology has provided us with the tools to identify SNPs in a straightforward way through the use of SNP chips. We have presented here an alternative to the standard method for the interpretation of these SNP chips. Our empirical results on the SARS strains are encouraging, as are the prospects for future SNP detection via this method. Besides its effective SNP-detection ability, additional strengths of our algorithm are (a) that its simplicity means that less calibration is needed, (b) it does most of its calibration on a single chip due to the use of the nearest-neighbor approach to classification, (c) that training examples for our nearest-neighbor approach are created via our simple-to-implement definitions of conformers and non-conformers, avoiding the need for a human to laboriously label examples, and (d) it does not require the use of high-resolution scanners. A Self-Tuning Method for One-Chip SNP Identification Michael Molla1,2, Jude Shavlik1, Thomas Albert2, Todd Richmond2, and Steven Smith2 1 Department of Computer Sciences, University of Wisconsin-Madison, Madison, WI 2 NimbleGen Systems, Inc. 1 Science Court, Madison, WI 53711