Download
1 / 27
270 likes | 473 Views
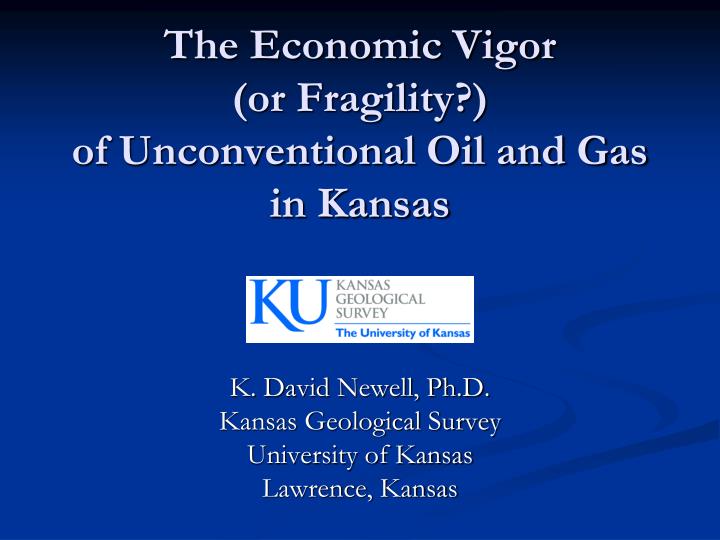
The Economic Vigor (or Fragility?) of Unconventional Oil and Gas in Kansas. K. David Newell, Ph.D. Kansas Geological Survey University of Kansas Lawrence, Kansas. Kansas Oil and Gas Fields. Current Oil and Gas Prices. Late August, 2012 oil price (WTI) = $95/bbl

E N D
The Economic Vigor (or Fragility?) of Unconventional Oil and Gas in Kansas K. David Newell, Ph.D. Kansas Geological Survey University of Kansas Lawrence, Kansas
Current Oil and Gas Prices • Late August, 2012 oil price (WTI) = $95/bbl • Late August, 2012 natural gas wellhead price = $2.75/mcf • On basis of BTUs, approx. 6000 cubic feet of natural gas (i.e., 6 mcf = 1 barrel [bbl]) of oil • 6 mcf natural gas fetches $16.50 vs. $95 for oil • THEREFORE…unless some prospect represents a potential for prolific rates and volumes of natural gas, no one is now looking solely for it
GENERALIZATION Most companies prefer a return of drilling and completion costs of a producing well in about 2 to 3 years (operational costs, equipment, dry holes, salt-water disposal wells, etc. have to be paid, but are not included in this calculation)
P I Brown Nemaha Marshall KANSAS COALBED METHANEPRODUCTION Doniphan Washington Pottawatomie Clay Riley Atchison Jackson Shawnee Wyandotte Dickinson Jefferson Leavenworth Johnson Geary Osage Morris Wabaunsee Douglas Franklin Lyon Miami Marion Chase Linn Coffey Anderson Harvey Section with CBM production Bourbon Woodson Sedgwick Allen Section with CBM well, no production Wilson Crawford Greenwood Butler Gas pipeline Sumner Neosho Cowley Elk Humbolt Fault System (western limit of Cherokee and Forest City Basins) M Neosho Cherokee Chautauqua Montgomery Miss.-Penn. outcrop 25 miles 25 km
CALCULATED CUMULATIVE PRODUCTION CBM WELLS IN SOUTHEASTERN KANSAS(assuming typical declines, 5 mcf/day production shut-down) 250,000 90th-percentile well 4314 mcf/month peak prod. 200,000 233.7 million cubic ft in 23 years Cumulative Production 75th-percentile well 150,000 2498 mcf/month peak prod. mcf 130.3 million cubic ft in 19 years (thousand cubic ft) 65th-percentile (average) well 100,000 2000 mcf/month peak prod. 101.4 million cubic ft in 17 years 50th-percentile (median) well 1466 mcf/month peak prod. 71.6 million cubic ft in 15 years 50,000 25th-percentile well 812 mcf/month peak prod. $125K @ $3/mcf 33.6 million cubic ft in 10 years 10th-percentile well $125K @ $6/mcf 380 mcf/month peak prod. $125K @ $9/mcf 8.8 million cubic ft in 4 years 0 0 5 10 15 20 25 years producing
CALCULATED CUMULATIVE PRODUCTION CBM WELLS IN SOUTHEASTERN KANSAS(assuming typical declines, 5 mcf/day production shut-down) 250,000 % of CBM wells paying $125K drilling & completion costs in 2 years 8% @ $2/mcf 18% @ $3/mcf 50% @ $6/mcf 70% @ $9/mcf 90th-percentile well 4314 mcf/month peak prod. 200,000 233.7 million cubic ft in 23 years Cumulative Production 75th-percentile well 150,000 2498 mcf/month peak prod. mcf 130.3 million cubic ft in 19 years (thousand cubic ft) 65th-percentile (average) well 100,000 2000 mcf/month peak prod. 101.4 million cubic ft in 17 years 50th-percentile (median) well 1466 mcf/month peak prod. 71.6 million cubic ft in 15 years 50,000 25th-percentile well 812 mcf/month peak prod. $125K @ $3/mcf 33.6 million cubic ft in 10 years 10th-percentile well $125K @ $6/mcf 380 mcf/month peak prod. $125K @ $9/mcf 8.8 million cubic ft in 4 years 0 0 5 10 15 20 25 2 years years producing
Coalbed Natural Gas Wells Drilled per Yearin Eastern Kansas vs. Gas Price 1600 1598 1400 1200 1183 Total Number of Wells with Spud Dates = 7,672 Number of Wells per Year 1000 980 968* 800 687 600 479 400 300 234 200 86 88 78* 70 72 51 52 41 34 31 9 11 12 10 12 11 0 7 7 3 2 0 1981 1985 1990 1995 2000 2005 2009 Year 16 Natural 12 Gas Price 8 ($ per 4 MMBTU) 0 1985 1990 1995 2000 2005 2010
Kansas City StarApril 1988“The story of the dying Hugoton gas field, how America handled its natural gas resources and why in the not-too-distant future your gas bills will make you scream”
Kansas Gas Production 1930-2007 KC Star Article
Coalbed Natural Gas WellsDrilled per Year in Eastern Kansas 1600 1598 KC Star Article 1400 1200 1183 Total Number of Wells with Spud Dates = 7,672 Number of Wells per Year 1000 980 968* 800 687 600 479 400 300 234 200 86 88 78* 70 72 51 52 41 34 31 9 11 12 10 12 11 0 7 7 3 2 0 1981 1985 1990 1995 2000 2005 2009 Year 16 Natural 12 Gas Price 8 ($ per 4 MMBTU) 0 1985 1990 1995 2000 2005 2010
Moral of this Story? Don’t believe everything that you read in the newspapers? Bad news always sells? A pessimist is usually right, given enough time? The speaker has a long-standing grudge against the KC Star? NO, NOT NECESSARILY ANY OF THE ABOVE…
What will happen to the price for oil and gas? ANSWER: It’s hard to predict because it’s governed by many complex factors, some of which are unpredictable
Supply and Demand of Oil and Natural Gas (thus its price) are influenced by: • Geology (fewer and poorer wells, supply goes down) • State of the Economy (economy up, supply goes down) • Tropical Storms (more hurricanes, supply goes down) • Winter Weather (temperature down, supply goes down) • Producers Reaction to Price (price low, supply goes down) • U.S. Dollar (dollar down, supply goes down) • Oil-Cartel Behavior (supply usually goes down)
Mississippian Limestone Play~300 intents~100 wells drilled45 wells reporting production<<< Horizontal Wells in Kansashorizontal wells drilled into low-permeable limestone and then hydrofractured>>>
NUMBER OF INTENTS-TO-DRILL IN A SIX-COUNTY TIER ALONG THE OKLAHOMA STATE LINE INTENTS-TO-DRILL SOUTHERN AND WESTERN KANSAS May, July, Sept, Nov, Jan, Mar, May, July, 2011 2011 2011 2011 2012 2012 2012 2012 50 (half-month time increments. May, 2011 through mid-August, 2012) 45 NUMBER of INTENTS-TO-DRILL for HORIZONTAL WELLS in WESTERN KANSAS 40 May, July, Sept, Nov, Jan, Mar, May, July, 2011 2011 2011 2011 2012 2012 2012 2012 35 20 30 15 # of 25 # of Permits 10 Permits 20 5 15 0 10 5 0 (HORIZONTAL INTENTS IN RED) PERCENTAGE OF WELLS May, July, Sept, Nov, Jan, Mar, May, July, 2011 2011 2011 2011 2012 2012 2012 2012 100 90 The growing number of intents-to-drill for horizontal wells in southern and western Kansas 80 70 60 % 50 40 30 20 10 0
“Back-of-the-Envelope” Economics for Mississippian Horizontal Wellsin Kansas • ~$3,000,000 drilling and completion costs per horizontal well • Two-year pay-out for $3 million requires production of $4110/day income: • 41 bbls/day @ $100/bbl • 46 bbls/day @ $90/bbl • 51 bbls/day @ $80/bbl • 59 bbls/day @ $70/bbl
Monthly Oil and Gas Production from Mississippian Horizontal Wells in Kansas BOE (bbls of oil equivalent [6000 cfg = 1 boe]) 200,000 2½ % of Kansas O&G production 6,000 5,000 150,000 BOE/mo. 4,000 production BOE/day from wells 100,000 first reporting 3,000 in 2012 2,000 50,000 production from 1,000 wells first reporting in 2011 0 0 2010 2011 2012 YEAR 18 wells reporting production 45 wells reporting production
Pay-Out Ratesof some KS Horizontal Wells $100,000 $4110/day 458% (needed income for pay-out in twoyears, assuming cost of $3,000,000 per well) $10,000 avg. income per day (based on reported 102% pay out monthly production & 90% oil and gas price) 28% $1,000 32% $100 1 6 12 18 24 months of production (gas or oil) reported
250 Rig Counts in Midwestern States over Time Number of Rigs Operating in OK, ND, MT, & KS 200 150 # of rigs OK 100 ND 50 KS MT 0 2000 2001 2002 2003 2004 2005 2006 2007 2008 2009 2010 2011 2012 20% Number of Rigs Normalized to Total Operating Rigs in USA 15% % of US rigs OK 10% 5% ND KS MT 0% 2000 2001 2002 2003 2004 2005 2006 2007 2008 2009 2010 2011 2012 YEAR
. The Interplay of Rig Counts and Crude Oil Price in North Dakota 150 $150 $ per bbl 100 $100 Monthly Crude-Oil Rig Price Count ($ per bbl) 50 $ 50 rig count p u l l - b a c k start of Bakken boom 0 $ 0 Jan, Jan, Jan, Jan, Jan, Jan, Dec, 2005 2006 2007 2008 2009 2010 2010
Monthly data, 1st year of production) Average Production Rates45 Kansas Mississippian Horizontal Wells 38 bbls/day median 77 bbls/day average SandRidge Lori #1-2H (02-T35S-R10W, Barber Co.) SandRidge Bernice #1-17H OIL (07-T35S-R07W, Harper Co.) SandRidge Lake #1-21H (bbls/day) (21-T34S-R06W, Harper Co.) 0 100 200 300 400 500 600 700 SandRidge Bernice #1-17H SandRidge Ellis #1-19H (07-T35S-R07W, Harper Co.) (30-31S-19W, Comanche Co.) SandRidge Shrock #1-1H 67 boe/day average (01-T35S-R11W, Barber Co.) (400 mcf/day) GAS SandRidge Lori #1-2H (boe/day)* (02-T35S-R10W, Barber Co.) 0 100 200 300 400 500 600 700 (mcf/day) 0 1000 2000 3000 4000 SandRidge Shrock #1-1H 129 boe/day average (01-T35S-R11W, Barber Co.) SandRidge Lake #1-21H SandRidge Lori #1-2H OIL & GAS (21-T34S-R06W, Harper Co.) (02-T35S-R10W, Barber Co.) SandRidge Bernice #1-17H (boe/day)* (07-T35S-R07W, Harper Co.) 714 932 0 100 200 300 400 500 600 700 * 1 boe (barrel of oil equivalent) = 6 mcf)
The “Health” of Two Kansas Unconventional Plays • “Median commodity price” (where 50% of wells pay out in two years or less) for southeastern Kansas CBM play is ~$6/mcf. This play is moribund at the current price of $2.75/mcf. • “Median commodity price” (where 50% of wells pay out in two years or less) for Kansas Mississippian Horizontal play is ~$100/bbl. This play is reasonably healthy at the current price of $95/bbl.
The Economic Vigor (or Fragility?) of Unconventional Oil and Gas in Kansas K. David Newell, Ph.D. Kansas Geological Survey University of Kansas Lawrence, Kansas