Performance Overview of Thermal Generation and UI Charges in Indian Electricity Market (2002-2004)
This report provides an analysis of the thermal generation performance and system disturbances in the Indian electricity market between 2002 and 2004. It highlights bilateral sales by utilities, UI charges receivable, and disbursed amounts. Key figures include UI charges receivable of Rs. 780 crores and a total of Rs. 700 crores disbursed, with an efficiency rate of 89%. The report also details payments made by constituents, including JSEB and BSEB, as well as frequency profiles relevant to system operations.

Performance Overview of Thermal Generation and UI Charges in Indian Electricity Market (2002-2004)
E N D
Presentation Transcript
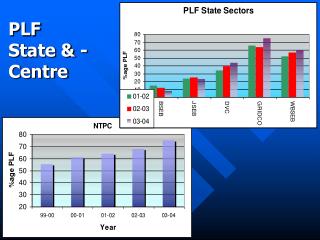
PLF State & -Centre
Bilateral sales by Utilities 2002-03= 287 Crores( approx) 2003-04=1448 Crores(approx) 2004-05: 646 Crores(approx)
Facts Related to UI UI Charges receivable as on date since 01.04.03 : Rs 780 cr UI Charges Received & disbursed as on date : Rs 700 cr Received/disbursed amount as % of total : 89% Main defaulting constituents JSEB : Rs. 43 cr BSEB : Rs. 31 cr Total No of payments made so far : 455 (320 + 135 ) No of time payments made : 84 (57 + 27) Total Receivable 509 cr in 03-04 and received 441 cr (87%)
PreABT Post ABT
FREQUENCY PROFILE FOR 31ST JANUARY,2004 (FGMO Implemented) STD : 0.17 Max : 50.32 Hz Min : 49.34 Hz