Latin Square Design
Diah Indriani Biostatistics and Populations Department Public Heath Faculty Airlangga University. Latin Square Design. Definisi. Disebut juga rancangan bujur sangkar latin

Latin Square Design
E N D
Presentation Transcript
Diah Indriani Biostatistics and Populations Department Public Heath Faculty Airlangga University Latin Square Design
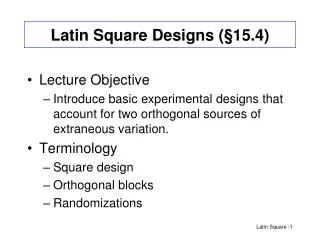
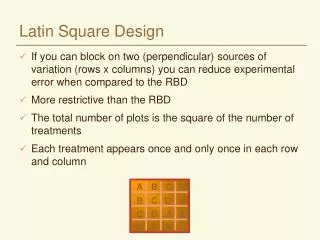
Definisi • Disebut juga rancangan bujur sangkar latin • Rancangan ini digunakan apabila satuan perlakuan hanya terjadi satu kali dalam baris dan kolom yang sama dengan tanpa mengorbankan prinsip acak • Hal ini hanya akan terjadi bila jumlah satuan perlakuan sama dengan jumlah baris dan jumlah kolom • Rancangan ini biasa disingkat dengan RBL Jika jumlah satuan perlakuan = jumlah baris = jumlah kolom = r , maka rancangan dapat ditulis dengan RBL rxr
Contoh Rancangan RBL • RBL 3x3 A B C B C A C A B • RBL 5x5 A B C D E B C D E A C D E A B D E A B C E A B C D Bentuk baku
Tahapan penempatan satuan perlakuan • Jika jumlah satuan perlakuan sebanyak r (misal r = 4), maka akan ada bentuk baku sebanyak (r!)2 buah atau misal (4!)2 = 576 buah bentuk baku. • Dari bentuk baku yang mungkin terjadi dipilih secara acak • Misalnya yang terpilih A B C D B C D A C D A B D A B C
Tahapan penempatan satuan perlakuan • Melakukan pengacakan menurut baris , misal bilangan acak yang terpilih (1 – 4) 2 4 1 3 artinya pengacakan menurut baris adalah 2 B C D A 4 D A B C 1 A B C D 3 C D A B
Tahapan penempatan satuan perlakuan • Melakukan pengacakan menurut kolom , misal bilangan acak yang terpilih (1 – 4) 3 4 2 1 artinya pengacakan menurut kolom adalah D A C B B C A D C D B A A B D C 3 4 2 1
Tahapan penempatan satuan perlakuan • Melakukan pengacakan menurut penempatan perlakuan , misal bilangan acak yang terpilih (1 – 4) 2 1 3 4 artinya pengacakan menurut penempatan perlakuan adalah Perlakuan 2 menempati A Perlakuan 1 menempati B Perlakuan 3 menempati C Perlakuan 4 menempati D
Penempatan satuan perlakuan Perlakuan 2 menempati A Perlakuan 1 menempati B Perlakuan 3 menempati C Perlakuan 4 menempati D D A C B B C A D C D B A A B D C
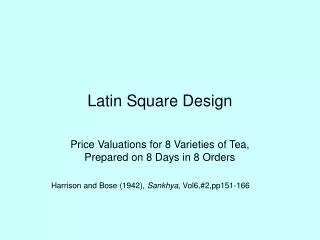
Contoh Kasus *------Change in Blood Sugar Levels in Mice: Latin Square-------* Four groups of mice, four days, and four treatments are arranged in a latin square design. The response is the mean change in blood sugar for 16 animals. The treatments are levels of insulin coded as follows: Level A for 150 micro units B 300 C 600 D 1200
Syntac Program dengan SAS data sugar; input day group $ insulin $ response; cards; 1 I B -4.5 1 II D 92.33 1 III C 59.83 1 IV A -45. 2 I C 91.83 2 II A -48.33 2 III D 168.99 2 IV B 89. 3 I D 86.16 3 II B -78.16 3 III A -24.17 3 IV C 101.0 4 I A -.17 4 II C 68.83 4 III B 25.17 4 IV D 177.17 ;
Syntac Program dengan SAS proc print; proc anova; classes day group insulin; model response= day group insulin; means day group insulin; data sugar2; set sugar; if insulin='A' then ins=150; else if insulin='B' then ins=300; else if insulin='C' then ins=600; else if insulin='D' then ins=1200; proc glm; classes day group; model response= day group ins ins*ins ins*ins*ins; proc sort out=c; by ins; proc means ; by ins; var response; run;
Output SAS Analysis of Variance Procedure Dependent Variable: RESPONSE Source DF Sum of Squares F Value Pr > F Model 9 82550.0871250 14.38 0.0021 Error 6 3826.7342500 Corrected Total 15 86376.8213750 R-Square C.V. RESPONSE Mean 0.955697 53.16874 47.4987500 Source DF Anova SS F Value Pr > F DAY 3 9420.0061250 4.92 0.0466 GROUP 3 10865.0431250 5.68 0.0347 INSULIN 3 62265.0378750 32.54 0.0004