
Uploaded by
marlee
1 SLIDES
199 VIEWS
10LIKES
PLSCR1
DESCRIPTION
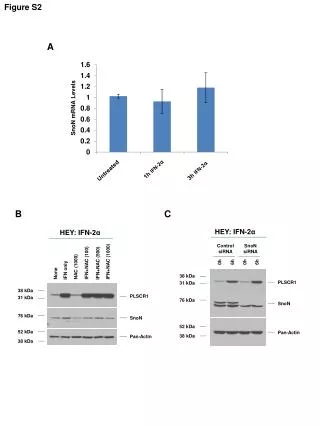
Figure S2. A. SnoN mRNA Levels. 1h IFN-2 α. Untreated. 3h IFN-2 α. C. B. HEY: IFN-2 α. HEY: IFN - 2α. Control siRNA. SnoN siRNA. 6h. 6h. IFN+NAC (1000). 0h. 0h. IFN+NAC (100). IFN+NAC (500). NAC (1000). IFN only. None. 38 kDa. PLSCR1. 31 kDa. 38 kDa. PLSCR1.
Download
1 / 1
Download Presentation 
PLSCR1
An Image/Link below is provided (as is) to download presentation
Download Policy: Content on the Website is provided to you AS IS for your information and personal use and may not be sold / licensed / shared on other websites without getting consent from its author.
Content is provided to you AS IS for your information and personal use only.
Download presentation by click this link.
While downloading, if for some reason you are not able to download a presentation, the publisher may have deleted the file from their server.
During download, if you can't get a presentation, the file might be deleted by the publisher.
E N D
Presentation Transcript
Figure S2 A SnoN mRNA Levels 1h IFN-2α Untreated 3h IFN-2α C B HEY: IFN-2α HEY: IFN-2α Control siRNA SnoN siRNA 6h 6h IFN+NAC (1000) 0h 0h IFN+NAC (100) IFN+NAC (500) NAC (1000) IFN only None 38 kDa PLSCR1 31 kDa 38 kDa PLSCR1 31 kDa 76 kDa SnoN 76 kDa SnoN 52 kDa 52 kDa Pan-Actin 38 kDa Pan-Actin 38 kDa

More Related
Audio
Live Player