Chap 8. Regression Line
Chap 8. Regression Line. Slope and Intercept The Method of Least Squares LS is not a panacea. SST, SSR, SSE ANOVA and ANCOVA Affix : Analysis for Price of APT and PPP. 1. 2. 3. 4. 5. Slope and Intercept. The Method of Least Squares. LS is not a Panacea. SST, SSR, SSE.

Chap 8. Regression Line
E N D
Presentation Transcript
Chap 8. Regression Line Slope and Intercept The Method of Least Squares LS is not a panacea. SST, SSR, SSE ANOVA and ANCOVA Affix : Analysis for Price of APT and PPP
1 2 3 4 5 Slope and Intercept The Method of Least Squares LS is not a Panacea SST, SSR, SSE ANOVA and ANCOVA INDEX Affix: Analysis for Price of APT and PPP
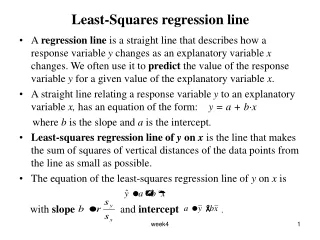
y y slope ( - ) D x slope (+) D D y y D x intercept intercept 0 x 0 x 1. Slope and Intercept Slope and Intercept
1. Slope and Intercept Education and income city men 198 age 30 - 40 Average education = 12.5years SD education = 2years Average income = \1,630,000 SD education = \770,000 Correlation coefficient = 0.33 The line slopes up. Showing that on the average, income does go up with education. Income(\10,000/month) Education(year)
monthly income Regression line (income)= \42,500 + (\127,000/year) (education) rSDy = \254,000 Average income \1,630,000 SDx = 2years 12.5years (\127,000) = \1,587,500 intercept = r(SDy/SDx) = \127,000/year intercept = \1,630,000 – \1,587,500 = \42,500 Average education =12.5years education 1. Slope and Intercept Finding the slope and intercept of the regression line
1. Slope and Intercept example 1 (1) (1) Find the income estimating line from education. (income) = \98,000 + (\72,000/year) (education) income Income and education for city women 108. Average education = 11years SD education = 3.6years Average income = \890,000 SD income = \600,000 r = 0.43 Average income = \890,000 intercept = \890,000 – 11years x(72,000/year) = 98,000 won Education average = 11years education
1. Slope and Intercept example 1 (2) (2) Predict the income of a woman whose education level is 12 and 16 years using the regression equation. Predicted income of women with 12 years education \98,000 + (\72,000/year) 12years = W962,000 Predicted income of women with 16 years education \98,000 + (\72,000) 16years = W1,250,000
1. Slope and Intercept Multiple regression often Multiple regression analysis Is useful statistical control Income(\10,000) ? Using the regression line estimated from data, we need scrupulous study to infer the population. Education level (years)
1 2 3 4 5 Slope and Intercept The Method of Least Squares LS is not a Panacea SST, SSR, SSE ANOVA and ANCOVA INDEX Affix: Analysis for Price of APT and PPP
step 1 step 2 Define an average distance from the line to all the points. Move the line until this average distance is as small as possible. 2. The Method of Squares LS line: the line best fits the scatter points Best fitting line to the scatter points? To much more points, Much closer. Among all lines, the one that makes the smallest RMSE in predicting from x is the regression line.
2. The Method of Squares Hook’s law (I) The stretch is proportional to the load.
2. The Method of Squares Hook’s law (2) a + bx Not all the points are on this line, but this is the line minimizing RMSE. length (cm) Least Squares Estimator a = 439.01cm b = 0.05cm/kg load (kg)
A B extrapolation Too weighty load makes the spring unable to come back to its original length. Limitation of Hook’s length(cm) load(kg) 2. The Method of Squares Hook’s law (3) With the measurement error, which one is more credible, A or B? B
1 2 3 4 5 Slope and Intercept The Method of Least Squares LS is not a Panacea SST, SSR, SSE ANOVA and ANCOVA INDEX Affix: Analysis for Price of APT and PPP
100 80 60 40 20 0 0 10 20 30 40 3. LS is not a Panacea. Even if the association looks linear, does the regression make sense? No! ? area = -66㎠ + (4㎝) (perimeter) Length and width determine both area and perimeter of a rectangle. area = (length) (width) perimeter = 2 (length + width) area(㎠) Correlation coefficient 0.98 The strong r just comes from the 3rd factors such as length and width determining both area and perimeter. Perimeter(㎝)
perfect? 3. LS is not a Panacea. Multiple regression At the [example1], how about considering slope as the pure effect of changes in education levels on income? The effects of other factors are included in the slope as well as the effect of education. Suppose educational level(E) and socioeconomic statue(S) of an individual’s parents(y) affect income of one. The effect of education, controlling for the effect of parental status
Multiple regression can be useless. 3. LS is not a Panacea. Multiple regression can be useless. (predicted area) = a + b(perimeter) + c(diagonal) Is it possible to know the exact effect of perimeter on the area? The perimeter and diagonal do determine the area, but only be a complicated nonlinear formula.
1 2 3 4 5 Slope and Intercept The Method of Least Squares LS is not a Panacea SST, SSR, SSE ANOVA and ANCOVA INDEX Affix: Analysis for Price of APT and PPP
인플레 인플레 인플레 연도 통화 증가율 연도 통화증가율 연도 통화증가율 이션율 이션율 이션율 1976 33.49 15.38 1986 18.44 2.82 1996 15.83 4.90 1977 39.70 10.00 1987 19.05 3.08 1997 14.14 4.48 1978 34.97 14.72 1988 21.50 7.14 1998 27.03 7.48 1979 24.58 18.49 1989 19.82 5.74 1999 27.38 0.85 1980 26.9 0 28.66 1990 17.17 8.50 2000 25.43 2.27 1981 25.02 21.29 1991 21.89 9.32 1982 27.01 7.14 1992 14.94 6.30 1983 15.24 3.43 1993 16.58 4.77 1984 7.71 2.21 1994 18.68 6.22 1985 15.62 2.34 1995 15.59 4.49 4. SST, SSR, SSE Yearly monetary increasing rate and inflation rate. Year 1976~2000 Yearly Monetary(M2) increasing rate and inflation rate (http://www.nso.go.kr) How much can it be explained by the M2 rate with 0.14% above the average the inflation rate with 1.24% above the average?
4. SST, SSR, SSE Regression analysis of inflation rate on monetary increasing rate Inflation rate(%) A(21.89%, 9.32%) Monetary increasing rate(%)
4. SST, SSR, SSE Analysis of SST (1) Other factors. Unverified by the monetary increasing rate. A(21.89%, 9.32%) = (xi, yi) 9.32 E Regression line = a + b xi 8.20 R 8.08 Verified by the regression line, monetary increasing rate average = T=R+E
4. SST, SSR, SSE Analysis of SST (2) SST = SSR + SSE SST Total Sum of Squares Total variation around the average of y SSR Regression Sum of Squares Variation verified by the regression line SSE Residual[error] Sum of Squares Variation not verified by the regression line
4. SST, SSR, SSE Coefficient of Determination R2 is the rate of the verified variation to the total variation. ref: in the simple regression analysis, R2is as same as the square of r, correlation coefficient.
1 2 3 4 5 Slope and Intercept The Method of Least Squares LS is not a Panacea SST, SSR, SSE ANOVA and ANCOVA INDEX Affix: Analysis for Price of APT and PPP
5. ANOVA and ANCOVA ANOVA and ANCOVA ANOVA (analysis of variance) SST analysis when explanatory variables are only made by dummy variables in the regression analysis. ANCOVA (analysis of covariance) SST analysis when explanatory variables contains all the variables continuous with dummy variables
5. ANOVA and ANCOVA Dummy variables • * Dummy variables • qualitative variables having only two values (0 or 1) such as male or female • are useful testing the significant difference on a dependent variable throughout the different groups. Is there a significant difference in the monthly income of men and women? yi = + Di + ui (i = 1, … , n) Dummy for sex i is male; 1 i is female; 0
5. ANOVA and ANCOVA ANOVA yi = + Di + ui (i = 1, … , n) = 0 ; test ANOVA • Raise the number of dummy variables as groups increase • 예) consisting of four groups overall, bring three dummies and a constant
5. ANOVA and ANCOVA ANCOVA Other differences controlling the difference of groups reflected by xi sex difference of yi* controlling the effect of xi from yi
1 2 3 4 5 Slope and Intercept The Method of Least Squares LS is not a Panacea SST, SSR, SSE ANOVA and ANCOVA INDEX Affix: Analysis for Price of APT and PPP
Affix: Analysis for price of APT and PPP • Exercise with actual data • Exercise with website data Empirical study for the prices of APTs in Gangnam, Seoul Empirical study for PPP (Purchasing Power Parity) with Big Mac index