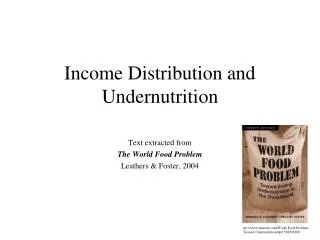
Download
1 / 1
60 likes | 1.67k Views
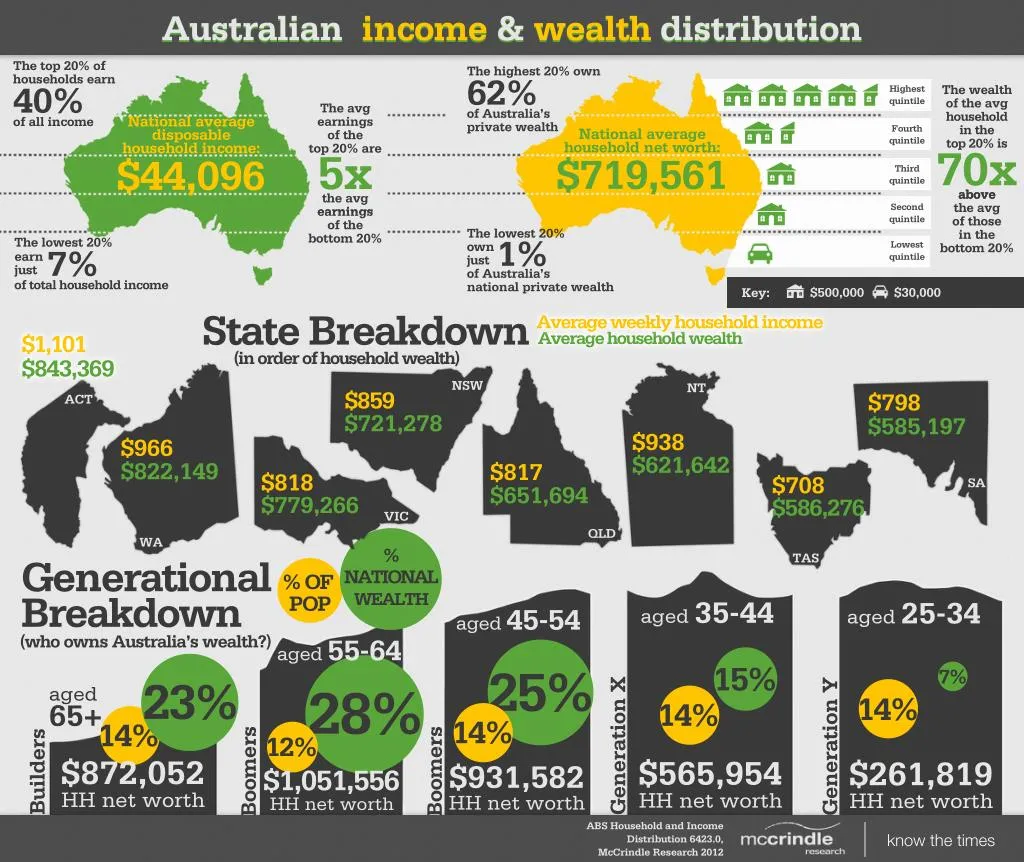
There are currently 9 million households in Australia, and in looking at the the disposable income of Aussie families, as well as the net worth of each Australian household - we've noticed quite the divide! Australia is known as being the land of the middle class- but there has been some significant shifts. The bottom 20% of households by wealth own 1% of Australia's private wealth, while the top 20% own 62% of the wealth. Here's the McCrindle Research summary of income and wealth by quintiles.

E N D
Australian income & wealth distribution Australian income & wealth distribution The top 20% of households earn 40% of all income The highest 20% own 62% of Australia’s private wealth The wealth of the avg household in the top 20% is 70x above above the avg of those in the bottom 20% Highest quintile The avg earnings of the top 20% are 5x the avg earnings earnings of the bottom 20% National average disposable household income: $44,096 Fourth quintile National average household net worth: $719,561 Third quintile Second quintile The lowest 20% own just earn just 7% of total household income 1% of Australia’s national private wealth The lowest 20% Lowest quintile $500,000 $30,000 Key: (in order of household wealth) State Breakdown Average weekly household income Average household wealth $1,101 $843,369 NSW NT $859 $798 ACT $721,278 $585,197 $938 $966 $621,642 $822,149 $817 $818 $708 SA $651,694 $779,266 $586,276 VIC QLD WA % TAS Generational Breakdown (who owns Australia’s wealth?) NATIONAL WEALTH % OF POP aged 35-44 aged 25-34 aged 45-54 aged 55-64 15% 25% 14% $931,582 HH net worth 7% 23% Generation X Generation Y 28% 12% $1,051,556 HH net worth aged 65+14% $872,052 HH net worth 14% 14% Boomers Boomers Builders $565,954 HH net worth $261,819 HH net worth ABS Household and Income Distribution 6423.0, McCrindle Research 2012 know the times