Download
1 / 88
880 likes | 1.17k Views
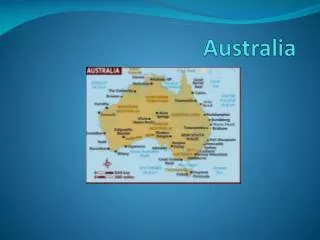
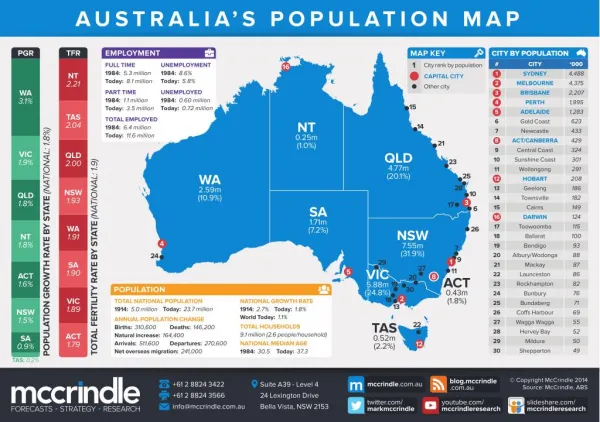
Let's take a look at different aspects of Australia's demographics and how each of our states stack up. <br>Sydney’s headcount will hit 5 million later this year, but can it keep its place as the nation’s biggest city? The state of Queensland is also set to mark a major milestone, as it hits 5 million, while Melbourne has maintained its lead as Australia's fastest growing city.<br><br>WHAT WILL A POPULATION OF 5 MILLION MEAN FOR SYDNEY?<br>More densification and more urbanisation. 1 in 5 Australians lives in Sydney and it’s been one of the fastest growing cities and from a population perspective it’s Australia's leading city. For every new detached home that is built in Sydney, you now have 2 units or townhouses, so it’s the vertical communities not just the horizontal ones – that’s what will mark Sydney’s future as the city continues to grow.<br><br>NSW IS GOING TO HIT 8 MILLION, BUT QUEENSLAND IS GOING TO HIT A MILESTONE TOO<br>Queensland is closing in on the 5 million mark, and around the same time, Sydney gets to 5 million. Queensland is interesting because it’s the most decentralised of our states, more than half of the population lives outside of its capital of Brisbane. It’s has 11 of Australia's 30 largest cities, while NSW only has 5. For NSW, two thirds of the whole state lives in the one city of Sydney.<br><br>IN TERMS OF POPULATION GROWTH, HOW DO THE OTHER CAPITAL CITIES COMPARE WITH SYDNEY?<br>It’s really all about Sydney and Melbourne, in terms of the size of the cities, they are the largest cities. We have slower growing states like South Australia and Tasmania - in fact Melbourne is adding more people every 11 days than Tasmania adds in an entire year at the moment.<br><br>BY COMPARISON, HOW SLOW IS SOUTH AUSTRALIA’S GROWTH?<br>It is quite slow, it was 1959 that Sydney got to 2 million people, Adelaide won’t get to 2 million until 2055, about a century after Sydney got there. While it’s the fifth largest city, it’s a long way off the pace of Sydney and Melbourne. Interestingly, in the year that both Sydney and Melbourne get to 8 million, it will be in that year that Adelaide gets to 2 million.

E N D
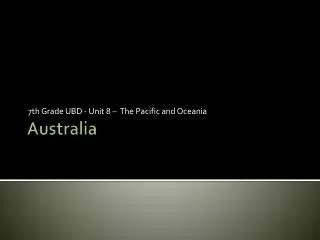
THE KEY POPULATION TRENDS TRANSFORMING AUSTRALIA’S CITIES Mark McCrindle IronfishChina Property Investment Forum 2016
AUSTRALIA TODAY 24m
AUSTRALIA DEFINED The lucky country
UNEMPLOYMENT RATE 5.7%
UNEMPLOYMENT RATE 5.7% 6.1% (U5)
UNEMPLOYMENT RATE 5.7% 6.1% (U5) 8.8% (Eurozone)
UNEMPLOYMENT RATE 5.7% 6.1% (U5) 8.8% (Eurozone) 10.3%
UNEMPLOYMENT RATE 5.7% 6.1% (U5) 8.8% (Eurozone) 10.3% 24.4%
AUSTRALIA DEFINED Downunder
AUSTRALIA DEFINED The clever country
AUSTRALIA’S CITIES: THE TOP 15 ● ● ● ● BRISBANE ● ● ● PERTH ● ● SYDNEY ● ● ADELAIDE ● ● MELBOURNE ● ●
AUSTRALIA’S LARGEST CITY: SYDNEY ● ● ● ● BRISBANE ● ● ● PERTH ● ● SYDNEY ● ● ADELAIDE ● ● MELBOURNE ● ●
SUPERIOR URBAN LIVING INDEX SCORES 1. CROWS NEST – WAVERTON 85 1. SURRY HILLS 85 3. PYRMONT – ULTIMO 83 3. MARRICKVILLE 83 5.POTTS POINT – WOOLLOOMOOLOO 82 5. NORTH SYDNEY – LAVENDAR BAY 82 5. RANDWICK 82 5. CHATSWOOD (EAST) – ARTARMON 82 5. LEICHHARDT – ANNANDALE 82
THE 2 MILLION CLUB Sydney Melbourne Brisbane Perth 1959 2014 1975 2008