
cMyc
Supplementary Figure 2. A. MCM4. cMyc. TOP1. LaminB2. -1. 0. +1. +2. +3. -1. 0. +1. -4. -2. 0. 0. +3. PRKDC. MCM4. TOP1. cMyc. LaminB2. PPV1. -1. OR. +2. +3. -1. OR. +1. In3. OR. Ex3. OR. B. D. HBO1 (T20) binding. MOF binding. 50. 30. Occupancy.

cMyc
E N D
Presentation Transcript
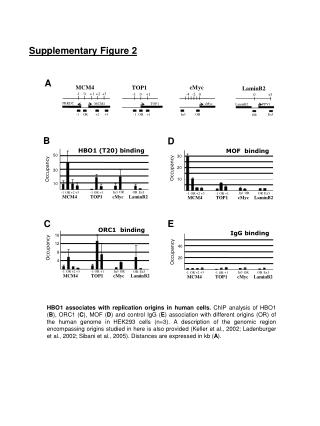
Supplementary Figure 2 A MCM4 cMyc TOP1 LaminB2 -1 0 +1 +2 +3 -1 0 +1 -4 -2 0 0 +3 PRKDC MCM4 TOP1 cMyc LaminB2 PPV1 -1 OR +2 +3 -1 OR +1 In3 OR Ex3 OR B D HBO1 (T20) binding MOF binding 50 30 Occupancy Occupancy 20 30 10 10 OR In3 OR Ex3 -1 OR +2 -1 +1 +3 OR OR In3 OR Ex3 -1 OR +2 -1 +1 +3 OR MCM4 TOP1 cMyc LaminB2 MCM4 TOP1 cMyc LaminB2 C E ORC1 binding IgG binding 16 12 Occupancy 40 Occupancy 8 20 4 -1 OR +2 -1 +1 OR +3 OR In3 OR Ex3 +3 In3 OR Ex3 -1 OR +2 -1 +1 OR OR MCM4 TOP1 cMyc LaminB2 MCM4 TOP1 cMyc LaminB2 HBO1 associates with replication origins in human cells. ChIP analysis of HBO1 (B), ORC1 (C), MOF (D) and control IgG (E) association with different origins (OR) of the human genome in HEK293 cells (n=3). A description of the genomic region encompassing origins studied in here is also provided (Keller et al., 2002; Ladenburger et al., 2002; Sibani et al., 2005). Distances are expressed in kb (A).