Canonical Correlation Analysis
Learn about Canonical Correlation Analysis, a statistical technique to study relationships among multiple sets of variables. Explore its uses, assumptions, and practical applications.

Canonical Correlation Analysis
E N D
Presentation Transcript
Canonical correlation analysis (CCA) is a statistical technique that facilitates the study of interrelationships among sets of multiple dependent variables and multiple independent variables. Whereas multiple regression analysis is used to predict the value of a single (metric) dependent variable from a linear function of a set of independent variables, canonical correlation analysis predicts multiple dependent variables from multiple independent variables.
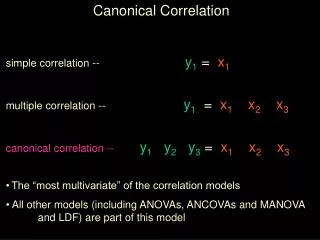
Canonical Correlation • Measuring the relationship between two separate sets of variables. • This is also considered multivariate multiple regression (MMR)
Canonical Correlation • Often called Set correlation • Set 1 • Set 2 • p doesn’t have to equal q • Number of cases required ≈ 10 per variable in the social sciences where typical reliability is .80, if higher reliability than less subjects per variable are sufficient.
Canonical Correlation • In general, CanCorr is a method that basically does multiple regression on both sides of the equation • This isn’t really what happens but you can think of this way in general.
Canonical Correlation • A better way to think about it: • Creating some single variable that represents the Xs and another single variable that represents the Ys. • This could be by merely creating composites (e.g. sum or mean) • Or by creating linear combinations of variables based on shared variance:
Canonical Correlation • Make a note that the arrows are coming from the measured variables to the canonical variates.
Background • Canonical Correlation is one of the most general multivariate forms – multiple regression, discriminate function analysis and MANOVA are all special cases of CanCorr • It is essentially a correlational method. • In multiple regression the linear combinations of Xs we use to predict y is really a single canonical variate.
Questions • How strongly does a set of variables relate to another set of variables? That is how strong is the canonical correlation? • How strongly does a variables relate to its own canonical correlate? • How strongly does a variable relate to the other set’s canonical variate?
Canonical Correlation • In Canonical correlation, you have two sets of two or more interval-level (scale) variables each and you want to see how differences in one set relate to differences in the other set of variables. With canonical correlation, unlike regression, there is no distinction between independent and dependent variables; they are called by SPSS “Set 1” and “Set 2”. • One would use canonical correlation when the variables in each set can be grouped together conceptually, but you want to see if there are particular subsets of them that relate to subsets in the other variable set, so you do not want to sum each set to make an overall score.
Canonical Correlation: Conditions and Assumptions • CONDITIONS: • All variables in canonical correlation must be scale. • It is recommended to have at least 10 subjects per variable in order to have adequate power. • ASSUMPTIONS: • linearity of relationship (between each variable pair as well as between the variables and the linear composites). • Multivariate normality (evaluate univariate normality - because multivariate normality is difficult to assess) • Homoscedasticity (evaluate using matrix scatterplot of the canonical variate scores) • Multicollinearity(evaluate using matrix scatterplot of the canonical variate scores)
Assumptions • MulticollinearityCheck Set 1 and Set 2 separately • Run correlations and use the collinearity diagnostics function in regular multiple regression • Outliers – Check for both univariate and multivariate outliers on both set 1 and set 2 separately
Assumptions • Normality • Univariate – univariate normality is not explicitly required for MMR • Multivariate – multivariate normality is required and there is no way to test for except establishing univariate normality on all variables, even though this is still no guarantee.
Assumptions • Linearity – linear relationship assumed for all variables in each set and also between sets • Homoscedasticity (that is, when one vari- able exhibits similar amount of variance across the range of values for the other variable) – needs to be checked for all pairs of variables within and between sets.
Example: Canonical CorrelationFile: hsbdataNew.sav First, download the files “Canonical correlation.sps”, “Canonical Corr_MANOVA_Syntax1” and “Canonical Corr_Syntax2” to C: drive. Open Canonical correlation.sps and Run it, by selecting the entire contents. In the same worksheet, Open the data file hsbdataNew.sav Open File – New – Syntax Copy the contents of Canonical Corr_MANOVA_Syntax1. Highlight/Select the contents and Run. We get the output for checking the assumptions of Canonical Correlation. Open File – New – Syntax Copy the contents of Canonical Corr_Syntax2. Highlight/Select the contents and Run. We get the output for Canonical Correlation analysis.