Download
1 / 28
280 likes | 392 Views
Massachusetts Cancer Registry. Cancer Incidence and Mortality in Massachusetts, 1995-1999. Bureau of Health Statistics, Research and Evaluation Massachusetts Department of Public Health. Statewide Report. Cancer Incidence and Mortality (1995-1999)

E N D
Massachusetts Cancer Registry Cancer Incidence and Mortality in Massachusetts,1995-1999 Bureau of Health Statistics, Research and Evaluation Massachusetts Department of Public Health
Statewide Report • Cancer Incidence and Mortality (1995-1999) • Cancer Incidence Trends in Massachusetts Over Time
New Features • Race/Ethnicity Data • 2000 US Population Standard • No comparison with SEER/NCHS
Example of 1970 vs 2000 Standards1995 Cancer Incidence Data* * age-adjusted rates per 100,000
Massachusetts Cancer IncidenceNewly Diagnosed Cases1995-1999 156,735 diagnosed cases - 77,922 in males - 78,787 in females
Distribution of Cancer Incidence Massachusetts, 1995-1999Males Females Prostate 30.4% Breast 31.6% Other 36.6% Other 36.8% Uterine 6.1% Bronchus & Lung 13.1% Urinary Bladder 4.9% Bronchus & Lung 15.6% Colon/Rectum 12.6% Colon/Rectum 12.3% n = 77,922 n = 78,787
Distribution of Cancer Deaths Massachusetts, 1995-1999Males Females Bronchus & Lung 28.8% Bronchus & Lung 23.1% Other 44.2% Other 42.9% Breast 16.3% Prostate 11.5% Pancreas 4.7% Pancreas 5.6% Colon/Rectum 10.8% Colon/Rectum 12.1% n = 34,822 n = 34,843
Massachusetts Incidence Rates*1995 vs. 1999 * rates per 100,000; age-adjusted to 2000 standard million
Massachusetts Mortality Rates*1995 vs. 1999 * rates per 100,000; age-adjusted to 2000 standard million
Leading Cancers by Race/Ethnicity Males, 1995-1999 * incidence rates per 100,000; age-adjusted to the 2000 standard million
Leading Cancers by Race/Ethnicity Females, 1995-1999 * incidence rates per 100,000; age-adjusted to the 2000 standard million
Leading Cancer Deaths by Race/Ethnicity, Males, 1995-1999 * mortality rates per 100,000; age-adjusted to the 2000 standard million
Leading Cancer Deaths by Race/Ethnicity, Females, 1995-1999 * mortality rates per 100,000; age-adjusted to the 2000 standard million
1995 vs. 1999 Incidence Rates*, MA Males * rates per 100,000; age-adjusted to 2000 standard million
Annual Age-Adjusted Cancer Incidence Rates*Massachusetts Males, 1995-1999 per 100,000 males * age-adjusted to 2000 standard million
Annual Age-Adjusted Cancer Mortality Rates*Massachusetts Males, 1995-1999 per 100,000 males * age-adjusted to 2000 standard million
1995 vs. 1999 Incidence Rates*, MA Females * rates per 100,000; age-adjusted to 2000 standard million
Annual Age-Adjusted Cancer Incidence Rates*Massachusetts Females, 1995-1999 per 100,000 females * age-adjusted to 2000 standard million
Annual Age-Adjusted Cancer Mortality Rates*Massachusetts Females, 1995-1999 per 100,000 females * age-adjusted to 2000 standard million
Lung Cancer Incidence Rates* MA, 1995-1999 per 100,000 persons * age-adjusted to 2000 standard million
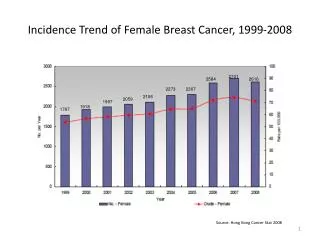
Prostate and Breast Cancer Incidence Rates* MA, 1995-1999 per 100,000 persons * age-adjusted to 2000 standard million
Prostate Cancer • Fall toward an equilibrium reflecting truly incident cases • Outpatient diagnoses • Decreased utilization of PSA screening tests
Colo-Rectal Cancer Incidence Rates* MA, 1995-1999 per 100,000 persons * age-adjusted to 2000 standard million
Colo-Rectal Cancer • Diet (increased intake of vegetables and other sources of fiber) • Use of nonsteroidal anti-inflammatory drugs such as aspirin • Earlier detection/screening • Removal of polyps
Conclusions Prostate cancer rates have increased 5.7% between 1995 and 1999, but there still has been an overall decrease from its peak incidence in 1992. Breast cancer, the leading cancer in females, increased 1.7% between 1995 and 1999. Lung cancer in females has increased 7.7% between 1995 and 1999.
Conclusions (cont.) • Melanoma increased in both males and females; 17.4% in males and 31.4% in females. • Leading cancers with increased incidence of at least 5% from 1995 through 1999 include: prostate and melanoma in males; lung and melanoma in females. • Leading cancers with decreased incidence of at least 5% from 1995 through 1999 include: oral cavity and pharynx and bladder cancer in males; ovarian and cervical in females.
Tobacco..................... 30% Adult Diet / Obesity... 30% All Other Factors....... 40% Estimated % of Total Cancer Deaths Attributable to Established Risk Factors (U.S.) Risk factor source: “Harvard Report on Cancer Prevention” in Cancer Causes & Control, International Association of Cancer Registries, 1996
MDPH Cancer Prevention and Early Detection Programs • Mass. Tobacco Control Program • Women’s Health Network • Chronic Disease Prevention Programs • Men’s Health Partnership • Skin Cancer Prevention Program • MA Skin Cancer Prevention Collaborative • Colorectal Cancer Awareness Program • Oral Cancer Partnership