Download
1 / 28
280 likes | 408 Views
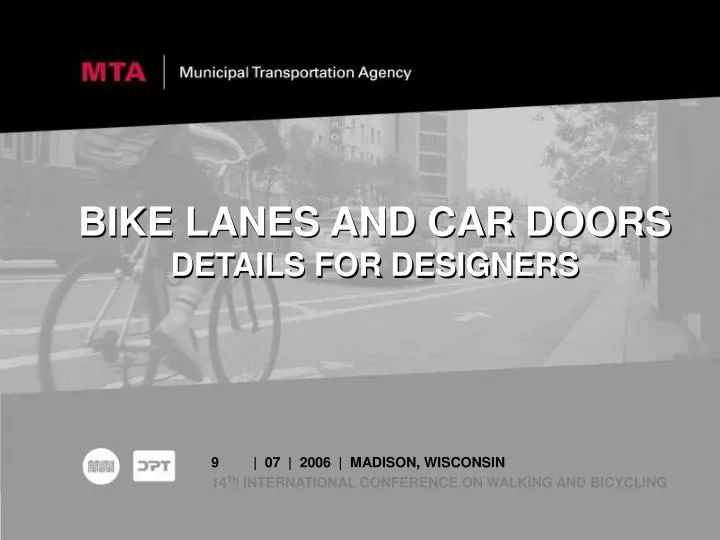
BIKE LANES AND CAR DOORS DETAILS FOR DESIGNERS. | 07 | 2006 | MADISON, WISCONSIN 14 TH INTERNATIONAL CONFERENCE ON WALKING AND BICYCLING. OUTLINE. SAN FRANCISCO – BACKGROUND AND BICYCLE NETWORK BICYCLE LANES – WHY AND HOW? STUDY #1 – PARKING LANE WIDTHS STUDY #2 – PARKING “T” MARKINGS

E N D
BIKE LANES AND CAR DOORSDETAILS FOR DESIGNERS | 07 | 2006 | MADISON, WISCONSIN 14TH INTERNATIONAL CONFERENCE ON WALKING AND BICYCLING
OUTLINE • SAN FRANCISCO – BACKGROUND AND BICYCLE NETWORK • BICYCLE LANES – WHY AND HOW? • STUDY #1 – PARKING LANE WIDTHS • STUDY #2 – PARKING “T” MARKINGS • RECOMMENDATIONS
SAN FRANCISCO Area: 47 Square Miles Population: 780,000 (2nd Densest City in U.S.) Terrain: Hills! (31.5% Steepest) Percent Bicycle to Work: 2.08%* Recent Poll: 5% of SF residents Use Bike as primary mode of transportation * 2000 Census (#1 in US cities w/ >500,000, 108% increase from 1990 Census)
BICYCLE NETWORK • 205 TOTAL MILES • 30 Miles of Bike Paths • 45 Miles of Bike Lanes • 130 Miles of Shared Roadways • -55 Miles of Wide Curb Lanes • -80 Miles of Narrow Curb Lanes
BICYCLE LANES San Francisco Bicycle Coalition's 2006 SurveyWhat would make San Francisco a better city for bicycling? #1 Response: More bike lanes (21%) 90% of respondents prefer to ride on streets with bike lanes rather than streets without (6% no opinion)
CARS AREN’T GOING AWAY* *YET Bay Area Trends 657 vehicles per 1000 persons in 1998 704 vehicles per 1000 persons in 2020 (Projected by Metropolitan Transportation Commission) San Francisco 480,000 Registered Vehicles 320,000 estimated on-street parking spaces High demand for on-street parking
BICYCLE LANE DESIGN AASHTO GUIDE FOR THE DEVELOPMENT OF BICYCLE FACILITIES MUTCD 2003 CALIFORNIA SUPPLEMENT CALIFORNIA HIGHWAY DESIGN MANUAL • Bike lanes adjacent to parking must be a minimum of 5’ wide • No minimum parking lane width
30 in (0.75m) 40 in (1.0m) BICYCLIST OPERATING SPACE From AASHTO “Guide for the Development of Bicycle Facilities”
CVC & ON-STREET PARKING CVC 22517. No person shall open the door of a vehicle on the side available to moving traffic unless it is reasonably safe to do so and can be done without interfering with the movement of such traffic, nor shall any person leave a door open upon the side of a vehicle available to moving traffic for a period of time longer than necessary to load or unload passengers.
DOORING COLLISIONS “The Door is Always Open” • San Francisco 2001-2005 • 1628 Bicycle Injury Collisions • 133 From Doorings (~8%) Courtesy of Department of Public Art - 1993
Red dashed line = 9.5’ from curb (85 percentile opened car doors) 50% in Door Zone 30% in Door Zone 10% in Door Zone
PARKING LANE WIDTH STUDY “This second line will encourage parking closer to the curb, providing added separation from motor vehicles…”Page 23, AASHTO Guide for the Development of Bicycle Facilities Will wider parking lanes encourage motorists to park further away from the curb?
STUDY LOCATION 11 Locations ~600 Observations
OTHER DESIGN FACTORS • Context is Key! • Wider Parking Lanes May Be Needed For: • Downhill Bike Lanes • Commercial Areas with High Parking Turnover • Areas Where Trucks Frequently Park to Load/Unload
Before - Parking “Ts” Extend to 9’ After - Parking “Ts” Extend to 11’
Before – Average Position After – Average Position
BEFORE Mean = 10’-4” 76% > 9.5’ 54% > 10’ 24% IN DOOR ZONE AFTER Mean = 10’-11” 90% > 9.5’ 76% > 10’ 10% IN DOOR ZONE
RECOMMENDATIONS • Where space permits, wider parking lanes should be provided next to bike lanes to give cyclists more buffer from opening car doors • Bike lane/parking lane design should take into account factors such as parking turnover, expected vehicle types, street grade • Extended parking “Ts” show potential for encouraging cyclists to ride outside the door zone • Design standards should be revisited, and should address door zone issue - Need for research with narrower bike lanes and other innovative treatments
Red dashed line = 9.5’ from curb (85 percentile opened car doors) 50% in Door Zone 30% in Door Zone 10% in Door Zone
Red dashed line = 9.5’ from curb (85 percentile opened car doors) 38% in Door Zone 13% in Door Zone 0% in Door Zone
Dustin WhiteSF Municipal Transportation Agencydustin.white@sfmta.com(415) 701-4603San Francisco Bicycle Program www.bicycle.sfgov.org