Download
1 / 31
310 likes | 477 Views
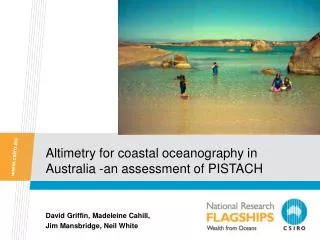
Altimetry for coastal oceanography in Australia -an assessment of PISTACH. David Griffin, Madeleine Cahill, Jim Mansbridge, Neil White. Much of Australia has shelf-edge jets. Australian Baseline Array of quality tidegauges. Since 2004: altimetry + tidegauge -> shelf current.

E N D
Altimetry for coastal oceanography in Australia -an assessment of PISTACH David Griffin, Madeleine Cahill, Jim Mansbridge, Neil White
Much of Australia has shelf-edge jets Insert presentation title
Australian Baseline Array of quality tidegauges Insert presentation title
Since 2004: altimetry + tidegauge -> shelf current Insert presentation title
First attempt at including PISTACH on-shelf FASL in a Jason-1, -2, Envisat, Tidegauges OI map • FASL=Filtered (ie no tides) Adjusted (ie bottom-pressure equivalent) Sea Level. (anomaly understood) Insert presentation title
One-month animation of FASL maps Insert presentation title
Doesn’t look right. What are we doing wrong? • SL = Orbit – range – iono – dry – wet – ssb – mss – solid Earth & pole tides. (correct either alt or TG for loading tide) • FSL = SL – geocentric ocean tides (alt), Low-pass filter TG • FASL = FSL – IB(isostatic) – HF corrections (MOG2d) • Options tried: • Orbit: IGDR MOE, GPS OGDR • Range: IGDR, OCE3, RED3 • Iono: GIM (J2 C band has problems) • Dry: model • Wet: radiometer, composite, decontaminated • SSB: ssb_ku • MSS: mss1(CLS01V1), mss3(DNSC08) • Ocean tide: tide1 (Got 00), tide2(FES04), tide3(GOT 4.7) Insert presentation title
Study period: cycles 1-43 (July 2008 – Sep 2009) • IGDR, PISTACH v0, v3, v4 • v0: MOE, mss3(DNSC08), red3, decont_wet, tide3(GOT4.7) • v3: oce3 • v4: composite wet • compute correlation, regression, mean and std dev of difference pointwise along track (1Hz averages) with • Esperance (70km shelf) and Thevenard (200km shelf) • for FASL, FSL, SL Insert presentation title
Esperance FASL corr with IGDR Insert presentation title
Esperance FASL corr with PISTACH v0. - much more data. (but why tracks different?) Insert presentation title
Esperance FASL corr with PISTACH v3 (oce3).- less correlation than red3 Insert presentation title
Esperance FASL regress with PISTACH v0.- implausible(?) gain pattern with red3, suspect noise Insert presentation title
Esperance FASL bias with PISTACH v0.- small along track gradient, but big inter-track difference Insert presentation title
Esperance FASL cf PISTACH v0 (3 closest good 1Hz).Much within-day change. Peaks unsampled. OI no hope Insert presentation title
Esperance FSL cf PISTACH v0 (3 closest good 1Hz).- IB relatively small Insert presentation title
Esperance SL cf PISTACH v0 (3 closest good 1Hz).errors are the same with IB and tides not removed Insert presentation title
Esperance SL cf PISTACH v0 (pass 64)- hard to complain with r=0.96 • r=0.96, G=0.84, std. dev 72mm, bias -111mm, 15km distance Insert presentation title
Esperance FASL cf PISTACH v0 (pass 64). r=0.67. sd 77mm. Residual tide + other HF? Insert presentation title
Esperance FASL cf PISTACH v0 (pass 227).- 3d offset: uncorrelated signal and errors cf pass 64 Insert presentation title
Reminder: problems near Thevenardpass 114, cycle 33: Insert presentation title
Thevenard SL corr with PISTACH v0.at coast: 114, 201, 23 Insert presentation title
Thevenard SL cf PISTACH v0 (pass 114)some big (400mm) errors, but 29 May OK: • r=0.88 G=0.65, sd 190mm, 28 km from coast Insert presentation title
Thevenard FASL cf PISTACH v0 (pass 114). errors up to 400mm, eg 29 May • r=0.56, G=0.54, sd=130mm. 9.8km from coast Insert presentation title
Thevenard SL cf PISTACH v0- note 3 high tides daily 29 May – 5 June Insert presentation title
Thevenard FASL cf PISTACH v0.400mm error on 29 May ruined OI map Insert presentation title
Burnie (pass 225) • 500mm+ outliers • otherwise good Insert presentation title
Burnie J1 CalVal.40.5mm std dev using GDR-C Insert presentation title
Conclusions • PISTACH data has much to offer compared with standard products. But please: more documentation of data products! • These three example tidegauges highlight unresolved site-specific issues • Esperance: SL has 70mm std dev noise. ~OK • Big discrepancies at Thevenard not yet explained. • For FASL, some of the error may be un-modelled M3 tide (cf R Ray) • But SL errors are also large (up to 400mm,130mm sd) • must also remember: 10-day sampling grossly inadequate to capture all shelf variability • even daily-averages are inadequate, need 12h. • To do: 1) better tide model, 2) check SSB Insert presentation title
Thankyou • Pierre Thibaut, Franck Mercier, Claire Dufau Insert presentation title
Esperance FASL regress with IGDR.- question did not arise with IGDR Insert presentation title
Esperance FASL regress with PISTACH v3 (OCE3).- severe coastal trapping Insert presentation title