Download

1 / 25
250 likes | 490 Views
An Investigation into Using Google Trends as an Administrative Data Source in ONS. Daniel Ayoubkhani Time Series Analysis Branch Survey Methodology and Statistical Computing Division Office for National Statistics, UK. Overview. Introduction to Google Trends 2. Using Google Trends Data

E N D
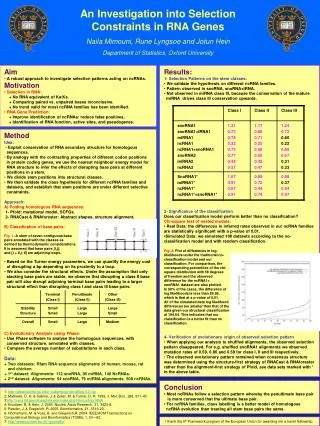
An Investigation into Using Google Trends as an Administrative Data Source in ONS Daniel Ayoubkhani Time Series Analysis Branch Survey Methodology and Statistical Computing Division Office for National Statistics, UK
Overview • Introduction to Google Trends 2. Using Google Trends Data An Investigation Conducted by ONS: 3. Data 4. Methods • Results • Conclusions and Considerations
1. Introduction to Google Trends • Google provide weekly data on changes in search query share (rather than volume) • need to convert to levels and aggregate to months/quarters • Data are available: • back to the start of January 2004 • for individual search queries, 25 top level categories and hundreds of lower level categories • for free, to anyone with a Gmail account, from: www.google.com/trends
1. Introduction to Google Trends Example – Google searches for “statistics” Source: Google Trends
1. Introduction to Google Trends Example – Search query to top level classification: “statistics” Poverty & Hunger Demographics Social Sciences Social Issues & Advocacy People & Society Reference
2. Using Google Trends Data • Choi, H and Varian, H (2009) Predicting the Present with Google Trends: • Paper pioneered use of Google Trends data as a nowcasting tool for economic variables • Fitted log–linear models to US retail, automotive and home sales • Predictive performance of models increased when Google Trends terms were included • Many studies using Google Trends data for prediction of economic variables published since then
2. Using Google Trends Data • Potential uses of Google Trends (GT) data identified by ONS: • Quality assurance of outputs • Nowcasting of outputs • Replacement of existing data sources • Focus of this investigation: quality assurance of the UK Retail Sales Index (RSI)
2. Using Google Trends Data Aims of this investigation: • Fit benchmark models that are representative of current ONS practice • Fit alternative models that include appropriate GT terms as predictors • Compare models using empirical measures • Draw conclusions to inform ONS strategy
3. Data - Retail Sales Index • All Retail Sales • Non-Specialised Food Stores • Non-Specialised Non-Food Stores • Textiles, Clothing and Footwear • Furniture and Lighting • Home Appliances • Hardware, Paints and Glass • Audio and Video Equipment and Recordings • Books, Newspapers and Stationary • Computers and Telecommunications • Non-Store Retailing
3. Data - Retail Sales Index Source: ONS
3. Data - Google Trends • All extracted GT time series: • represent weekly UK search activity • start in January 2004 • end in July 2011 • Each RSI series matched with: • at least one GT search category • top five search queries with each category
4. Methods - Benchmark Models RegARIMA (linear regression + ARIMA noise) • Regression terms capture deterministic effects: • inconsistent survey periods due to 4-4-5 design • moving holidays (e.g. Easter) • additive outliers and level shifts • ARMA terms capture autocorrelation in the regression residuals • Non-stationarity handled via log transformation and differencing • Models automatically identified and estimated using X-12-ARIMA
4. Methods - Alternative Models Benchmark models extended with (log transformed, differenced) GT variables: • “Forced” static relationships estimated for all series • Lagged relationships identified from cross-correlation plots of pre-whitened series: • fit ARIMA models to all RSI and GT series • correlate each RSI residual series with each of its corresponding GT residual series • (i.e. remove trend and seasonality and correlate the shocks) • Relationships identified at more than one lag modelled both individually and together
4. Methods - Alternative Models Example – Furniture and Lighting vs “garden”:
5. Results - Initial Analysis • Furniture and Lighting – top three models in terms of AICC:
5. Results - More Recent Analysis • Focused on GT search categories due to transient nature of popular search queries • Compared models using out-of-sample, one-step-ahead predictions • relies on having sufficient number of observations for initial fitting • 24 periods: May 2010 to April 2012 • only calculated for models with significant GT terms
5. Results - More Recent Analysis Furniture and Lighting:
6. Conclusions and Considerations • Promising results for some RSI components... • Furniture and Lighting • Hardware, Paints and Glass • Audio Equipment and Recordings • ...but less so for others • All Retail Sales • Non-Specialised Food Stores • Non-Specialised Non-Food Stores • Additional information is only useful when the RSI series is not dominated by trend and seasonality
6. Conclusions and Considerations 1. GT variable selection • millions of potential explanatory variables • need for automation • Google Correlate • popularity of search queries is transitory:
6. Conclusions and Considerations 2. Changes to GT categorisation taxonomy • happened in December 2011 • new categories created • infrequent categories deleted • changes to taxonomic parents • became possible to have more than one parent 3. GT data only available from 2004 onwards • most ONS economic series start much earlier
6. Conclusions and Considerations 4. Some factors affect the response variable but not the GT predictor (or vice-versa), even if the model performs well overall • e.g. heavy snowfall prevents customers travelling to shops, but internet sales unlikely to be adversely affected 5. Wider applicability to outputs • key economic outputs e.g. Index of Services • other possibilities – e.g. migration? 6. Future cost and accessibility of GT data?