Download
1 / 45
470 likes | 636 Views
Mission Impossible III Integrative Genomics in 60 min. Carlos Afonso Sylvie Estrela Tiago Macedo (PDBC 2008). I. Introduction (and Outline). Biological (Scientific) studies involve Data : observations of a biological system

E N D
Mission Impossible IIIIntegrative Genomics in 60 min. Carlos Afonso Sylvie Estrela Tiago Macedo (PDBC 2008)
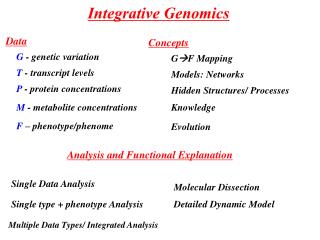
I. Introduction (and Outline) Biological (Scientific) studies involve • Data: observations of a biological system • Concepts: provide the foundations for appropriate modelling and data interpretation • Analyses: provide the formal structure of the modelled system and the statistical framework in which models are fitted to data II. (New) High Throughput Technologies/Data • provide understanding at different scales from genotype to phenotype (six sources): • Genome • Epigenome • Transcriptome • Proteome • Metabolome • Example • Phenome Need for Integrative Genomics/Biology • Putting together the different levels of information/data III. Concepts • The Central Dogma (G –> F) • (Biological) Networks • Genealogical Relationships (Evolution) • Knowledge • Hidden Structures Data + Concepts -> Models, Analyses IV. Analyses • Analysesof phenotype with another sources of data • Analyses of phenotype with genetic data (G+F) • Example • Integrated analysis of phenotype with at least two other sources of data • Integrated Networks • Example V. Functional Explanation VI. Conclusions Integrative Genomics, Carlos, Tiago, Sylvie (PDBC2008)
II. OMICS types - Genome (G) - Epigenome (E) - Transcriptome (T) - Proteome (P) - Metabolome (M) - Phenome (F) - Mettalome, lipidome, glycome, interactome, spliceome, mechanome, exposome, etc...
Epigenomic - The study of epigenetics at a global scale - Epigenetics: Heritable changes in phenotype or gene expression caused by mechanisms other than changes in DNA sequence. These changes may remain through cell divisions for the remainder of the cell's life and may also last for multiple generations. - Main areas of study: - Chemical modifications to DNA (methylation) - Changes in DNA packaging (histone modifications) - Techniques: - Chromatin immunoprecipitation (ChIP) / ChIP-on-CHIP (microarrays) (location of DNA binding sites on the genome for a particular protein)
Epigenomic - Epigenetic processes are spread on the genome - May be modified over time: - Environmental changes - Stochasticity (copying mechanisms related to DNA methylation are 96% accurate) - can be responsible for incomplete penetrance of genetic diseases (shown for identical twins -> different phenotypes)
Transcriptomic - Transcriptome is the set of all mRNA molecules (transcripts), produced in one or in a population of cells. - Genes showing similarity in expression pattern may be functionally related and under the same genetic control mechanism. - Information about the transcript levels is needed for understanding gene regulatory networks. - Gene expression patterns varies according to cell type, and there is stochasticity within cell types. - High throughput Techniques: cDNA microarrays and oligo-microarrays, cDNA-AFLP and SAGE - mRNA levels can't be measured directly due to technical and biological sources of noise (array stickiness, fluorescent dye effects and varying degrees of hybridisation) - May target single-cell mRNA levels, but generally targets 100s-1000s of cells.
Proteomic - Large scale study of protein structure and functions. - Expression level of a coding gene's more direct measurement is the amount of synthesized protein. - Proteome size is 10X greater than the # of protein coding genes (~24,000). - # of potentially physiologically relevant protein-protein interactions is ~650,000 - Protein abundances cannot be measured directly, and single-cell global profiling is not viable. - Techniques: - Mass spectrometry: proteins are fragmented and all peptides in a sample are separated by their mass-charge ratio. - 2D gel electrophoresis: Proteins are separated according to specific properties (mass, isoeletric point). Up to 10,000 spots on a gel. - Protein arrays: based on the hybridization of proteins to specific antibodies
Metabolomic - Focuses on the study of the products of cellular processes involving proteins and/or other metabolites. - ~6500 cataloged human metabolites (may be in the order of tens of 1000s) - Techniques: NMR spectroscopy, mass spectroscopy, chromatography and vibrational spectroscopes. - Very dynamic and adaptable to environmental changes. Profiling uses multiple cells, from tissues or biofluids.
Phenomic - Study and characterization of phenotypes, which represent the manifestation of interactions between genotype and the environment. - Phenome encompasses observations of E, T, P, M and G. - Precision and dimension of phenotype characterization has not improved as fast as other omics. - Global phenotyping should include many measurements, e.g. morphological, biochemical, behavioral or psychological. In addition, standardized procedures are required to allow comparisons between measurements.
- 1,126 metabolites across 262 clinical samples related to prostate cancer (42 tissues and 110 each of urine and plasma) - high-throughput liquid-and-gas-chromatography-based mass spectrometry - metabolomic profiles were able to distinguish: - benign prostate cancer - clinically localized prostate cancer - metastatic disease
- Amino acid metabolism and methylation were enriched during prostate cancer progression. - Find differential metabolites that: - characterize these processes - additionally, show a progressive increase from benign to PCA to metastatic disease. - amino acid metabolite; sarcosine
Correlation coefficient = 0.943 - Characterization of metabolomic signatures - In the context of other molecular alterations may lead to a more complete understanding of disease progression - Identification of sarcosine as a key metabolite - Increases more robustly in metastatic prostate cancer - Detectable in the urine of men with organ-confined disease
III. Concepts • The biological models and data analyses are founded on basic/general concepts • The Central Dogma of Molecular Biology (a mapping from Genotype to Phenotype) • (Biological) Networks • Genealogical Relationships (Evolution) • Knowledge • Hidden Structures • This concepts are accepted and used so frequently that they are often taken for granted and used without question • It is important to think about them Integrative Genomics, Carlos, Tiago, Sylvie (PDBC2008)
III. Concepts – 1. The Central Dogma (G –> F) • Genotype to phenotype mapping • focus on predicting the modification to phenotype in the presence of different genetic variants; • are very general, they rarely attempt to describe functionality. • Mapping the genome to a single phenotype is done by • breaking down the genome into regions according to a set of genetic markers • or simply by mapping a subset of genetic loci which show variation in a population. • Penetrance function: characterizes how variation at markers influences phenotype • Genetic effects are completely (or highly) penetrant for mendelian phenotypes: • P(Y=y) = I{g1=g} = 1 or 0 • Complex phenotype - Incomplete/Low penetrance • phenotype is modified with probability less than 1 in the presence of a genetic variant • reflects other influences on phenotype such as other genetic, epigenetic or environmental exposures. • (general) Mapping function G –> F: • h(E(Y)) = f(g, e, x) • expectation of a phenotype Y (r. v. indirectly accounts for noise and unknown sources of variation) • for a set of genetic markers g, epigenetic factors e, and external environmental exposures x. • Functionality Integrative Genomics, Carlos, Tiago, Sylvie (PDBC2008)
III. Concepts – 2. (Biological) Networks [1/2] Networks attempt to provide a more functional explanation by involving quantities at the molecular/celular level. Networks use approximations to reduce the problems (e.g. 10^41 –> 10^5): • Molecular Approximations: • Biomolecules represented by their observed abundance e.g. a gene represented by its observed mRNA expression level. • Nodes (labelled with genes for example) considered ‘on’ or ‘off’. • Physical interactions between molecules considered to be ‘present’ or ‘absent’. • Many molecules excluded, either because they are unobserved or not considered important to the system being modelled. • Temporal Approximations: • Single snap shot observations of data to construct networks representative of a system at a single point in time (usually assumed to be in a steady state). • Dynamical systems approximated by a few charateristics such as rate parameters in a system of ordinary or stochastic differential equations. • Dynamical systems approximated according to obervations at a discrete set of time points appropriately chosen according to the time scale of the system of study. Integrative Genomics, Carlos, Tiago, Sylvie (PDBC2008)
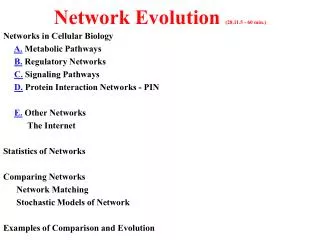
III. Concepts – 2. (Biological) Networks [2/2] There are four well established types of biological network which (approximately) determine function and phenotype at a cellular level. • Protein Interaction, Signal Transduction, Gene/Transcription Regulatory, and Metabolic Pathways Networks Biological networks are (re)constructed according to the existing biological knowledge and data – two categories are used for the interpretation of global variation data sets: • Theoretical Modelling • based on existing biological knowledge and physical/chemical laws; • no data in its raw form is used; • is successful for dynamic modelling of signalling pathways, transcriptional regulatory networks and metabolic pathways. • Statistical Modelling • uses observations of data at the nodes to infer edges; • a range of statistical techniques can be used to infer networks • at a single snap shot in time or • dynamic networks over a range of time points; • can be effective for both small and large data sets; • can also be used in conjunction with theoretical models to provide a more detailed description of a system (e.g. to infer rate parameters of a metabolicreaction) Integrative Genomics, Carlos, Tiago, Sylvie (PDBC2008)
III. Concepts – 3. Genealogical Relationships (Evolution) Models of evolution are important to characterise the uncertainty over possible genealogies consistentwiththe data Genomic variation can be observed at three levels: • Across cells within an individual • related by ontogenic tree • Across individuals within a population • related by a pedigree • Across species • related by a phylogeny. Rate of genomic variation in the human-mouse • between species genomes: 1 in 50 nucleotides; • between two individuals genomes: 1 in 1000 (200) nucleotides; • betweentwocellsgenomes: 1 in 10^7-10^8 nucleotides. (Genomes change at the) three categories of evolution provide different sources of information: • Species level:ideal for measuring rates and selection • Population level: give the functional interpretation of the actual content of the genome in terms of molecular mechanism • Cell level: mainly used on cancer studies • due to the intense interest in this disease and fast chromosomal evolution in cancer cells. Basic rates of evolutionary events allow us to understand the mechanism of organismal change: • The strength and direction of selection can be a consequence of genome function. • In particular, regions under positive selection experience an increased rate of evolution relative to neutrality • and can be indicative of functional regions which adapt to environment. Integrative Genomics, Carlos, Tiago, Sylvie (PDBC2008)
III. Concepts – 4. Knowledge (and Hidden Structures) • All studies are founded on a certain level of biological knowledge • True facts (P=1) & facts with a uncertainty degree (Bayesian framework) • Confirmed/Indicated by experiment results • The other concepts described in this section are also founded on biological knowledge that is accepted to be true • the central dogma underpins the concept of a mapping from genotype to phenotype, • knowledge of biomolecules which physically interact motivate development of network models, • knowledge about evolutionary processes motivates the use of genealogies. • Furthermore, knowledge that there are hidden structures present in data motivates development of (statistical) models to infer these unobserved states. • The increasing numbers of studies of biological variation, necessitates the development of a consistent representation of knowledge and tools to efficiently exchanged it • There are several tools for cataloguing and collating knowledge • Ontologies and Databases • Systems Biology markup languages • Process Algebras • Text Mining Methods Integrative Genomics, Carlos, Tiago, Sylvie (PDBC2008)
IV. Whichclasses are oftencombinedinanalysis? • 1 - Analysis of single sources of data • 1.1 -Species Level Genomic Variation Data; (G) • 1.2 -Human Genetic Variation Data; (G) • 1.3- Molecular Quantities; (T), (M), (P) • 2- Analysis of phenotype with another source of data • 2.1 Analysis of phenotype with genetic data; (G+F) • 2.2 Analysis of phenotype with molecular data; (F + T), (F + P), (F + M) • 2.3 Analysis of genetic data with molecular data; (G + T), (G + P), (G + M) • 3- Analysis with multiple molecular data types; (T + P), (T + M), (M + P), (T + P + M) • 4- Integrated analysis of phenotype with at least two other sources of data • 4.1 -Comparing genetic associations with different phenotypes • 4.2- Integrated Networks • 5- Analysis of all data types across multiple species
Analysisofphenotypewithgenetic data G F Widely popular field for a number of years Founded on the assumption that there is a map from G F • Linkage mapping • Genetic markers and clinical phenotypes collected from families of closely related individuals. • Pedigree data • 2.Genome-wide-Association Studies (GWAS) • Genetic markers and clinical phenotypes collected from distantly related individuals. • Population data
Analysisofphenotypewithgenetic data G F • Linkage mapping studies of families • Advantages- Useful for identifying broad regions (up to 10cM) harbouring phenotype-influencing location(s); such regions may contain many genes. • Most powered to detect highly penetrant single genes influencing a phenotype • Current marker of choice - SNP • LOD score- reported as a score for determining genetic associations. • Disadvantages- Poor power to detect associations to complex diseases with multiple genetic components. 2.Genome-wide-Association Studies (GWAS) Current marker of choice - SNP Advantages- Allow for much greater resolution in the fine-mapping of phenotype-influencing loci p-values based on chi-squared or other statistics reported as scores for testing associations. Disadvantages- Power to detect true associations via GWA methods depend primarily on sample size and the effect sizes and minor allele frequencies of the loci involved.
G F Analysis of phenotype with genetic data 2. Genome-wide-Association 1. Linkage mapping Disease locations can be better localized with GWA compared to using pedigree data.
G F Prostate cancer association across a genetic region on chromosome 17 in humans (Lange, E., Hum Genet , 2007) Genealogical relationships Chromosome 17 linkage mapping Hidden structures F G LOD scores applied to pedigree data of 147 families with BOTH four or more prostate cancer family members and an average age of <65 years, using 15 microsatellites markers. Refined localization of the putative chromosome 17q prostate cancer gene
G F Prostate cancer association across a genetic region on chromosome 17 in humans (Gudmundsson, J., Nat Genet, 2007) Genealogical relationships Hidden structures Genome-wide-Association for the chromosome 17 in the Icelandic study population 1,501 Icelandic men with prostate cancer and 11,290 controls - HumanHap300 SNP chip (310250 SNPs) that are located between position 30 Mb and the telomere (~78.6 Mb) on the long arm of chromosome 17. - The six SNP markers that fall within the linkage region described in (Lange, E., Hum Genet , 2007)
G F Prostate cancer association across a genetic region on chromosome 17 in humans (Gudmundsson, J., Nat Genet, 2007) Genealogical relationships Hidden structures These SNPs mapped to two distinct regions on chromosome 17q that are both within a region with LOD scores ranging from 1–2 but outside the proposed 10-cM candidate gene region (17q21-22) reported in the linkage analysis proposed by Lange, E., Hum Genet , 2007. This illustrates how the many recombination events in the extensive evolutionary history of these haplotypes act to break down associations amongst genetic variants, so that disease locations can be better localized compared to using pedigree data.
Integrated analysis of phenotype with at least two other sources of data Two ways in which data sources can be combined Analyzed separately and then compared Analyzed simultaneously • Comparing genetic associations with different phenotypes • Integrated Networks Use a mixture of the concepts, clearly founded on the concept of a network but they also draw on existing biological knowledge and the idea of a mapping from G F
Integrated Networks High-level view of the flow of information in biological systems through a hierarchy of networks (Sieberts et al, Mamm Genome, 2007) IN aimed at processing high-dimensional biological data by integrating data from multiple sources, and can provide a path to inferring causal associations between genes and disease.
G F T Describe a multistep process to extract causal information from gene-expression data related to complex phenotypes such as obesity and gene expression. Identification of colocalization of cis-acting eQTLs with chromosomal regions controlling a complex trait of interest(obesity) Map of expression quantitative trait loci (eQTLs): chromosomal regions that control the level of expression of a particular gene
G F T Use of QTL data to infer relationships between RNA levels and complex traits (Schadt et al, Nat Genet, 2005) Several graphical models to represent possible relationships between QTLs, RNA levels and complex traits once the expression of a gene (R) and a complex trait (C) have been shown to be under the control of a common QTL (L).
G F Hypothetical gene network for disease traits and related comorbidities T (Schadt et al, Nat Genet, 2005)
G F Likelihood-based causality model selection (LCMS) test : Uses conditional correlation measures to determine which relationship among traits is best supported by the data. T • Assumption : • If two gene-expression traits are each driven by a strong cis-acting eQTL, and these eQTLs are closely linked, they will induce a correlation structure between the two traits. Validation: (Schadt et al, Nat Genet, 2005) The two genes are positively correlated (cor. coef. = 0.75). This is probably induced by the two genes having closely linked eQTLs and not a result of any functional relationship.
G F A multistep procedure to identify causal genes for obesity in mice T Step 1- Build a genetic model for the omental fat pad mass (OFPM) trait, identifying the underlying QTLs that reflect the initial perturbations that give rise to the genetic components of the trait. Step 2- For each overlapping expression-OFPM QTL in the set of genes, they fit the corresponding QTL genotypes, gene-expression data and OFPM data to the independent, causal and reactive likelihood models. Result 1- Causal model as best model Step 3 - Rank-ordered the genes according to the percentage of genetic variance in the OFPM trait that was causally explained by variation in their transcript abundances Result 2-Of these genes, Hsd11b1 was one of the best candidates.
G F Transcriptional responses driven by perturbations to Hsd11b1 T Given the causal association between expression of Hsd11b1 and the OFPM trait Wanted to elucidate the transcriptional network associated with Hsd11b1 Hsd11b1 expression trait (control mice) Hsd11b1 expression trait (mice with inhibitor) Compare + + All other gene expression traits All other gene expression traits Applied the LCMS procedure to identify genes predicted to respond to Hsd11b1
G F Result 3- Ninety genes tested as causal for the OFPM trait at one or more QTLs T The gold standard for validating this type of prediction is the construction of animals that are genetically altered with respect to the activity of the gene of interest followed by screens for variations in the trait of interest C3ar1 mutant Tgfbr2 mutant (Schadt et al, Nat Genet, 2005) Validate C3ar1 and Tgfbr2 as new susceptibiltity genes causal for obesity Results indicate that integrating genotypic and expression data may help the search for new targets for common human diseases
V. Functional Explanation • To gain a full functional understanding of the etiology of a complex phenotype involves • identifying the genetic, molecular, and environmental attributes that influence the phenotype, and • elucidating the biological pathway that fully defines the influence and describes how it occurs. • The analysis approaches that we have discussed can be helpful in identifying features of (1) and (2) • But experimental validation is necessary for a comprehensive “functional explanation” Integrative Genomics, Carlos, Tiago, Sylvie (PDBC2008)
VI. Conclusions • We have talked about: Data, Concepts, Analyses • The goal of biosciences: Full understanding and predictive modelling of biological systems • But the global genome-wide studies describe systems of a size that cannot bemodelled to this level in the foreseeable future. • Functional interpretation is attempted by integrative studies and systems biology but both of these techniques are still too high level to provide full functional explanations at a molecular or atomic level. • This level of understanding will be the result of bottom-up approaches which provide a more detailed understanding of smaller systemsorfewer genes. • We are presently seeing the rise of high throughput studies. • The near future will probably see Mathematical Modelling being important to everyone. • and/or advances on IntegrativeBiology (top-down) & SystemsBiology (bottom-up) anditsrelations Integrative Genomics, Carlos, Tiago, Sylvie (PDBC2008)
Just in Case Integrative Genomics, Carlos, Tiago, Sylvie (PDBC2008)
Fig.1 with Legend Integrative Genomics, Carlos, Tiago, Sylvie (PDBC2008)
V. Functional Explanation – 1. Identifying Causal Genetic Variants • Comprehensive functional characterisation of a genetic variant will involve studies of • Epigenetic, • Genetic • and Environmental interactions • together with full molecular dissection. • IntegrativeGenomics (throughGWAS) are the most high-profile means of a first stage attempt to accomplish the genetic component Integrative Genomics, Carlos, Tiago, Sylvie (PDBC2008)
V. Functional Explanation – 2. Identifying Causal Pathways and Networks • Causal pathways and networks inferred statistically lack functional characterization. • Validating an entire global network is a huge task and usually specific pathways are prioritised and targetted for characterization. • Validation can be done via the perturbation of a system (e.g. genetic perturbation) • but even these studies do not provide a functional characterization of what biological processes are: • they merely provide support that the pathways are real. • The identification of a causal pathway cannot be considered true • until the mechanisms and molecular functions are fully characterised, • i. e., until fully annotating the links in a pathway with a biological process or reaction. • It is a difficult problem • Possible solution: • Integrative Genomics (top-down) & Systems Biology (bottom-up) ? Integrative Genomics, Carlos, Tiago, Sylvie (PDBC2008)
Recicalgem Integrative Genomics, Carlos, Tiago, Sylvie (PDBC2008)
V. Functional Explanation – 3. Forwards and Reverse Genetics • The majority of techniques we describe in this paper take a forwards genetics approach; data is gathered with reference to a phenotype and observations used to identify its causes. An alternative approach is reverse genetics where the starting point of a study is a set of genetic mutations and subsequent observations of phenotype are screened for differences. Both approaches aim to characterise the effect of genetic variation on phenotype. • Perturbation experiments in cell lines or model organisms are an example of reverse genetics, a genetic or molecular adjustment is made (e.g. a gene is knocked out) and the consequences on phenotype are observed. They are useful for validation and refinement of hypotheses which are important to direct the focus of functional studies but are not likely to be informative at a fine level for human systems. This is because human mechanisms are often disrupted by very subtle effects rather than severe perturbations of the scale induced by gene knockouts, furthermore the functional effects of a genetic variant may take a long time to manifest. Integrative Genomics, Carlos, Tiago, Sylvie (PDBC2008)
Vários • Figuras ??? • Problem: 1a parte da secção ‘3.3.3 Genealogies relating species’ (p22): Deletirius mutation tornam dificil a identifcação da evolução em (recent !!! ???) “closely related species” • Figura 3 (p16) ??? • Ver parte final da secção 3.1 G -> F Mapping (p15): Systems Biology & Integrative Genomics !!! • Noise !!! • [ From III. Concepts ] C4. Biological Knowledge • Example: Central Dogma of Molecular Biology • which describes the flow of information from genotype through to protein (figure 1) Integrative Genomics, Carlos, Tiago, Sylvie (PDBC2008)
Fig.1 withOUT Legend Integrative Genomics, Carlos, Tiago, Sylvie (PDBC2008)