Download
1 / 13
130 likes | 267 Views
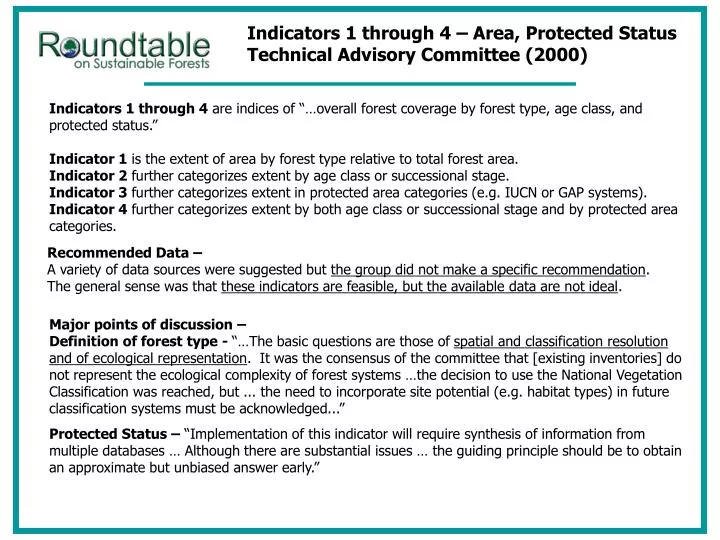
Indicators 1 through 4 – Area, Protected Status Technical Advisory Committee (2000). Indicators 1 through 4 are indices of “…overall forest coverage by forest type, age class, and protected status.” Indicator 1 is the extent of area by forest type relative to total forest area.

E N D
Indicators 1 through 4 – Area, Protected StatusTechnical Advisory Committee (2000) Indicators 1 through 4 are indices of “…overall forest coverage by forest type, age class, and protected status.” Indicator 1 is the extent of area by forest type relative to total forest area. Indicator 2 further categorizes extent by age class or successional stage. Indicator 3 further categorizes extent in protected area categories (e.g. IUCN or GAP systems). Indicator 4 further categorizes extent by both age class or successional stage and by protected area categories. Recommended Data –A variety of data sources were suggested but the group did not make a specific recommendation.The general sense was that these indicators are feasible, but the available data are not ideal. Major points of discussion –Definition of forest type - “…The basic questions are those of spatial and classification resolution and of ecological representation. It was the consensus of the committee that [existing inventories] do not represent the ecological complexity of forest systems …the decision to use the National Vegetation Classification was reached, but ... the need to incorporate site potential (e.g. habitat types) in future classification systems must be acknowledged...” Protected Status – “Implementation of this indicator will require synthesis of information from multiple databases … Although there are substantial issues … the guiding principle should be to obtain an approximate but unbiased answer early.”
Indicators 1 - 4 Measurement Protocols Indicators 1 and 2 – USFS FIA data (field inventory system) summarized according to forest type and age /size class. Indicators 3 and 4 – Overlay of Protected Area Database (PAD) map with national land-cover map (1-km res) to estimate proportion of each forest type in IUCN categories I through VI.
Refine the Indicator?Forest type area, age class, protected status (1 – 4) Data considerations FIA will continue to be the best available source for national estimates of area by forest type. Field data collection of NVC forest types has not been implemented. Crosswalking of FIA and NVC forest types is underway (completion in 2007?) Protected Area Database (PAD) development is continuing, Version 3 now available, ongoing project. Remote sensing has not yet provided a viable alternative to summarizing field-based inventories. Possible discussion items (examples) Should these indicators be combined? If one has Indicator 4, then one also has Indicators 1-3. Perhaps combine 1&2, and 3&4? Age class / successional stage is difficult to achieve (Indicators 2 and 4). Summaries by size class are relatively easy. Should the indicators be revised to take advantage of available data, or should the data collection be improved? FIA provides forest types but not a wall to wall map. Remote sensing provides a wall to wall map, but not forest types. Should there be an effort to integrate among these, and other data sources?
Indicator 5 – FragmentationTechnical Advisory Committee (2000) Fragmentation is “… an index of the extent to which forests are distributed as large blocks of habitat conducive to the maintenance of viable populations of flora and fauna…” Recommended Metrics –Average forest patch size Inter-patch distance Amount of forest edge Patch contrast Recommended Data –1992 Land-cover map from Thematic Mapper (0.09 hectare per pixel) Forest / nonforest classification A grid of analysis units ( 5625 ha each; metrics calculated within analysis unit) Recognized Limitations –No standards, baselines, or thresholds for metrics Interpretation is contingent (depends on organism, scale, location) “Forest” fragmentation, not “forest type” fragmentation No metrics for movement corridors Not easy to distinguish “natural” from “anthropogenic” fragmentation Fragmentation by roads not fully captured
Indicator 5 Measurement Protocols Establish a grid of 140,000 analysis units ( 56¼ km2 ) Each analysis unit contains 62,500 pixels, and 124,500 edges between pixels ContrastCount the frequencies of different land cover types Patch StatisticsMeasure the forest patch sizes, and distances between patch perimeters Edge StatisticsCount the frequencies of forest / forest edges, and forest / nonforest edges 7½ km Forest / Nonforest Map
Results – Indicator 5 Metric: Average patch size Most 5,625-ha landscapes contain a large number of patches that are less than one hectare in size, and about 10 percent contain one or more 2,000 to 5,000 hectare patches. Metric: Average inter-patch distance The perimeter of a typical forest patch is about 100 meters from the perimeter of its nearest neighbor, except when there is not much forest, in which case that distance is 200-300 meters. Metric: Amount of forest edge A typical 5,625-ha landscape has from 10 to 40 percent as much forest/nonforest edge as it could possibly have, given the amount of forest present. Metric: Patch contrast Most forest occurs in mostly-forested landscapes, where forest is the “background” upon which other land uses appear. Patch contrast is typically very high or very low in the eastern US, and intermediate in the western US.
General Statements of Findings of This and Other Recent US National Assessments – Indicator 5 • Feasibility. It is feasible to assess forest spatial patterns at multiple scales with fairly high-resolution maps in a consistent fashion nationwide. • How fragmented are the forests (at this data scale)? • Most forest land is connected to other forest land, over very large regions. • At the same time, fragmentation is so pervasive that edge effects potentially influence at least half of all forest. • Half of all fragmentation is attributable to small “perforations” (holes in patches) and the other half to patch “perimeters.” • Almost all of the fragmentation in the east is anthropogenic; in the west, most of the fragmentation is from semi-natural land cover (grassland, shrubland). • Scaling down – forest type, roads. • Demonstrated how to incorporate State vegetation maps to improve the interpretation with respect to “forest type.” • Demonstrated how to incorporate road maps to improve the interpretation with respect to “road caused fragmentation.”
Refine the Indicator? Spatial Pattern (5) Data considerations The available national maps present a complete and consistent picture, but the picture lacks detail. “Up-scaling” of local detail is not feasible; local maps are not comparable to each other, and some locations have no maps. “Down-scaling” is feasible in some circumstances. The next generation of the national maps (NLCD 2000) will not label “forest types”. The NLCD 2000 will perhaps support forest “change analysis” (change from NLCD 1992). Metric considerations (at this data scale) Correlations among current metrics. If you know the amount of forest, then you also know average patch size and edge density. Inter-patch distance metric was not very informative. From a technical standpoint, there is support for refining the metrics. The current set is not ideal, and has several technical flaws when applied to the available data. New measurement approaches might be better able to capture the Roundtable rationale about “interior” forest habitat. Possible discussion items (examples) What are the criteria for deciding if the four metrics should be changed? Should the Process be improved by obtaining data better suited to the metrics, or by refining the metrics so they are better suited to the available data. Should the metrics be refined before testing their efficacy for a “change analysis?” Should the metrics be refined before testing their efficacy for “explaining species data.” What has changed since the “recognized limitations” list was prepared in 2000?
Indicator Adequacy Ecosystemdiversityindicator Empirical basis Unambiguous Thresholds Standard Sensitive √ Amount (1, 2) √ √ √ = yes ? = weak or uncertain ? Protected status (3, 4) √ ? √ Spatial pattern (5) ? ? ? ? Do trends have an unambiguous interpretation? Is there an empirical basis for the indicator rationale? Has a standard for comparison been defined? Are thresholds known? How much is enough? Is the indicator sensitive? Does it provide an early warning? Conceptual model: Forest amount + protected status + spatial pattern habitat capacity Habitat capacity + species (occurrence + distribution) biodiversity