Download

1 / 26
260 likes | 402 Views
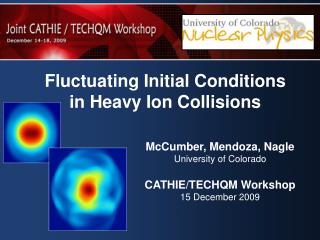
Hydrodynamic Tests of Fluctuating Initial Conditions. Transport Meeting 24 January 2012. George Moschelli & Hannu Holopainen. Motivation. Fluctuating Initial Conditions and Event-by-Event Studies Local Correlations Global Correlations Geometry Fluctuations.

E N D
Hydrodynamic Tests of Fluctuating Initial Conditions Transport Meeting 24 January 2012 George Moschelli & HannuHolopainen
Motivation • Fluctuating Initial Conditions • and • Event-by-Event Studies • Local Correlations • Global Correlations • Geometry Fluctuations Different initial conditions give different eccentricities and therefore different flow coefficients Event by event hydro… going beyond en and Yn …the three examples have different en because they have different numbers of sources with different sizes multiplicity fluctuations for example also depend on these things IP-Glasma: Schenke, Tribedy, Venugopalan, arXiv:1206.6805, Phys. Rev. Lett. 108 (2012) 252301 MC-KLN: Drescher, Nara, nucl-th/0611017
Local Correlations Initial State Configuration Final State Momentum • Final state momenta are correlated to initial position. • Reaction / event plane • Common origin • Influence of fluctuating ICs • Arbitrary event shapes. • Random number of sources and source sizes. Goal: Determine hydro response to “common origin” correlations and dependence on choice of IC.
Global Correlations • E-by-E Hydro Evolution • Ideal Hydro • Lattice EoS • Gaussian Energy Density lumps at mixture of MC GlauberNbin and Npart positions • Gaussian width: 0.4 fm Goal: Trace the evolution of fluid element correlations to freeze out.
Global Correlations • E-by-E Hydro Evolution • Ideal Hydro • Lattice EoS • Gaussian Energy Density lumps at mixture of MC GlauberNbin and Npart positions • Gaussian width: 0.4 fm Goal: Trace the evolution of fluid element correlations to freeze out.
Flow Lines Space Velocity • 20-30% centrality • Nbin = 464 • Npart = 176 • Freeze out: T = 120 MeV • Dots at initial positions of binary collisions • Movement indicates fluid cell position and velocity • Black line: const*e2 • Blue line: const*e3 • Green dots: randomly chosen group within 0.4 fm radius
Flow Lines Space Velocity • 20-30% centrality • Nbin = 464 • Npart = 176 • Freeze out: T = 120 MeV • Dots at initial positions of binary collisions • Movement indicates fluid cell position and velocity • Black line: const*e2 • Blue line: const*e3 • Green dots: randomly chosen group within 0.4 fm radius
Fluid-Fluid Correlations • “Emission” angle corresponds to initial spatial angle. Expectation: central (circular) collisions agree, peripheral (elliptical) collisions should deviate • Faster dots have larger displacement • Final velocity depends on initial position. → Angular correlations! • Faster dots freeze out first • Need mixed events 1-p
Average Displacement • Larger average displacement in central collisions • central collisions live longer • greater effect on common origin correlations than vn r0,max • Linear correlation between r0, Dr, and vFO • Flow lines starting at different radial positions get different transverse push. • Enhances common source correlations • Changes <en>time r0,min r0,max r0,min Goal: Determine a source “resolution”.
Freeze Out Time • Faster dots freeze out first • Blue: Event average 20-30% centrality • Red: single event with 464 Flow Lines • Average flow line lifetime longest in most central collisions
Freeze Out Time • Freeze out histograms indicate the flux of flow lines through the freeze out surface at different times.
Freeze out and Event Planes Space Velocity Alvioli, Holopainen, Eskola, Strikman arXiv:1112.5306 n = 1 w(r) = r3 n = 2 w(r) = r2 n = 3 w(r) = r3
e2 • Difference in initial eccentricities due to Glauber mixture IC vs. Nbin Flow Lines • Freeze out changes initial and final eccentricity • Freeze out velocity eccentricity represent a “time averaged” freeze out surface • Final eccentricity agrees with freeze out velocity eccentricity Goal: Study IC structure impact on time averaged velocity eccentricity.
e3 • Difference in initial eccentricities due to Glauber mixture IC vs. Nbin Flow Lines • Freeze out changes initial and final eccentricity • Freeze out velocity eccentricity represent a “time averaged” freeze out surface • Final eccentricity agrees with freeze out velocity eccentricity Goal: Study IC structure impact on time averaged velocity eccentricity.
en Distributions # Events Cartesian Space # Events Velocity Space Fluctuations can differentiate initial conditions
Multiplicity Fluctuations Gavin, MoschelliPhys.Rev. C79, 051902 (2009) For K sources that fluctuate per event Fluctuations in the number of sources Fluctuations per source Negative binomial distribution Gelis, Lappi, McLerranNucl.Phys. A828, 149 (2009) Schenke, Tribedy, Venugopalan, arXiv:1206.6805, Phys. Rev. Lett. 108 (2012) 252301
Negative Binomial Distribution Gavin, MoschelliPhys.Rev. C79, 051902 (2009) For K sources that fluctuate per event Fluctuations in the number of sources Fluctuations per source Negative binomial distribution Gelis, Lappi, McLerranNucl.Phys. A828, 149 (2009) NBD put in by hand Schenke, Tribedy, Venugopalan, arXiv:1206.6805, Phys. Rev. Lett. 108 (2012) 252301
Fluctuations and Correlations correlations = pairs - singles2 • Gavin, Moschelli • nucl-th/1107.3317 • nucl-th/1205.1218 Multiplicity Fluctuations Momentum Fluctuations “Flow Fluctuations”
The next step • IC lumps from K random sources • Poisson flow line multiplicity per source • Compare large <K> and small source size to small <K> and large source size • Compare to “smooth” hydro • Mixed Events • With and without aligned reaction / event planes • Angular Correlations • Compare en and vn with different IC • Radial cuts • Momentum, vn (eccentricity) and vn{2}2-vn{4}2 fluctuations
Summary • Freeze out effects • Eccentricity fluctuations • Event plane angle determination • Can we use hydro select the right IC? • Determine hydro response to “common origin” correlations and dependence on choice of IC. • Trace the evolution of fluid element correlations to freeze out. • Determine a source “resolution”. • Study IC structure impact on time averaged velocity eccentricity.
Cumulant Expansion Pair Distribution: Borghini, Dinh, Ollitrault Two-particle coefficient: • <vn>2= reaction plane correlations • s2n = other correlations • vn{4} <vn> • Borghini, Dinh, Ollitrault; • Voloshin, Poskanzer, Tang, Wang Correlated Part: vnfactorization is a signature of flow if sn= 0
The Soft Ridge Flow subtracted ridge • Only cosDfand cos 2Df terms subtracted • These terms also contain fluctuations • Glasma energy dependence • R scale factor set in • Au-Au 200 GeV • Blast wavef (p,x) • Difference in peripheral STAR→ALICE
Four-Particle Coefficients Four-Particle Distribution: keep only two-particle correlations Borghini, Dinh, and Ollitrault Four-particle coefficient: Voloshin, Poskanzer, Tang, Wang
vn{4} corrections Four-particle coefficient: Will cancel with vn{2} terms Corrections of order ~1.2%
R • K flux tubes, assume • Kvaries event-by-event For K sources that fluctuate per event Fluctuations in the number of sources Fluctuations per source