Download
1 / 16
160 likes | 283 Views
Development of Numeric Water Quality Criteria from the Satellite Record Blake Schaeffer 1 , James Hagy 1 , Robyn Conmy 1 , John Lehrter 1 , and Richard Stumpf 2 1 US EPA, Gulf Breeze, FL; 2 NOAA, Silver Spring, MD.

E N D
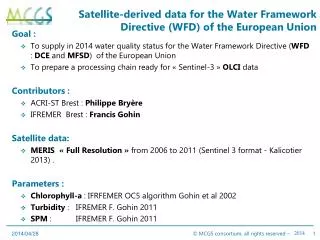
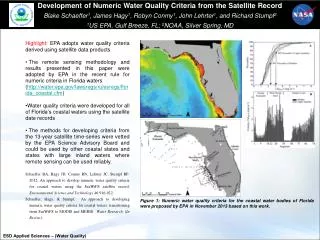
Development of Numeric Water Quality Criteria from the Satellite RecordBlake Schaeffer1, James Hagy1, Robyn Conmy1, John Lehrter1, and Richard Stumpf2 1US EPA, Gulf Breeze, FL; 2NOAA, Silver Spring, MD • Highlight: EPA adopts water quality criteria derived using satellite data products • The remote sensing methodology and results presented in this paper were adopted by EPA in the recent rule for numeric criteria in Florida waters • (http://water.epa.gov/lawsregs/rulesregs/florida_coastal.cfm) • Water quality criteria were developed for all of Florida’s coastal waters using the satellite date records • The methods for developing criteria from the 13-year satellite time-series were vetted by the EPA Science Advisory Board and could be used by other coastal states and states with large inland waters where remote sensing can be used reliably. • Schaeffer BA, Hagy JD, Conmy RN, Lehrter JC, Stumpf RP. 2012. An approach to develop numeric water quality criteria for coastal waters using the SeaWiFS satellite record. Environmental Science and Technology 46:916-922. • Schaeffer, Hagy, & Stumpf. An approach to developing numeric water quality criteria for coastal waters: transitioning from SeaWiFS to MODIS and MERIS. Water Research. (In Review). Figure 1: Numeric water quality criteria for the coastal water bodies of Florida were proposed by EPA in November 2013 based on this work. ESD Applied Sciences ̶ (Water Quality)
John Lehrter, US EPA lehrter.john@epa.gov 850-934-9255 The goal of this effort is to assist EPA in the development of numeric water quality standards (nutrient criteria). We developed an approach that was adopted by EPA for the state of Florida and which is generally applicable to other states and jurisdictions developing numeric nutrient criteria. Scientific Heritage: This work was made possible by the development of chlorophyll algorithms for case 1 (open ocean) waters [O’Reilly et al., 1998] and application to case 2 (coastal and estuarine) waters [Werdell et al., 2009] . NASA’s SeaDAS imagery processing software and NASA’s SeaBASS validation database [Werdell et al., 2002; 2003)] provided the image processing software and validation dataset, respectively. Earth Science Data Products: The Earth science satellite observations used for this application included imagery from NASA’s SeaWiFs and MODIS, and from ESA’s MERIS. Satellite observations were processed in NASA’s SeaDAS software for ocean color image processing and validated with NASA’s SeaBASS validation dataset. Technical Description of Figures: Figure 1: Phytoplankton biomass, determined as chlorophylla, as observed from SeaWiFs (upper). The 3 nm limit coastal water bodies where criteria were developed (lower) are shown along with the stations from NASA’s SeaBASS optical parameter dataset that were used to validate the chlorophylla algorithms. We developed a reference condition approach for the coastal water bodies based on cumulative frequency distributions of chlorophyllla occurrence as observed in the remote sensing record (right) Application to ESDAS: This work is relevant to the Applied Sciences program as it directly used NASA Earth science products to enable a decision-making activity by EPA, the first development of numeric nutrient criteria for coastal waters for the entire state of Florida, that otherwise would not have been possible. The impact of this outcome is that remote sensing data products are now viewed by the decision-makers in EPA as a viable data stream to support rule-making and the methods developed here will likely be used to develop water quality standards in the rest of the U.S. states and jurisdictions with coastal waters. High frequency (daily to weekly) engagement with decision-makers in EPA’s Office of Water was the norm during the development process. Once the decision-makers were convinced that the proposed methods could be applied, we were then asked to have the ideas, methods, and data vetted independently by EPA’s Science Advisory Board. Upon approval by the SAB, the methods and results were adopted by EPA in their formal rule-making docket for numeric criteria in Florida coastal waters (http://www.regulations.gov/#!docketDetail;D=EPA-HQ-OW-2010-0222). References: O’Reilly, J. E.; Maritorena, S.; Mitchell, B. G.; Siegel, D. A.; Carder, K. L.; Garver, S. A.; Kahru, M.; McClain, C. (1998), Ocean color chlorophyll algorithms for SeaWiFS. Journal of Geophysical Research, 103 (C11), 24,937−24,953. Werdell, P. J.; Bailey, S. W. (2002) The SeaWiFS Bio-optical Archive and Storage System (SeaBASS): Current Architecture and Implementation; NASA Goddard Space Flight Center: Greenbelt, p 45. Werdell, P. J.; Bailey, S. W.; Fargion, G. S.; Pietras, C.; Knobelspiesse, K. D.; Feldman, G. C.; McClain, C. R. Unique data repository facilitates ocean color satellite validation. EOS, Transactions. 2003, 84 (38), 377. Werdell, P. J.; Bailey, S. W.; Franz, B. A.; L., W. H. Jr.; Feldman, G. C.; McClain, C. R. Regional and seasonal variability of chlorophylla in Chesapeake bay as observed by SeaWiFS and MODIS-Aqua. Remote Sensing of the Environment, 2009, 113, 1319−1330. ESD Applied Sciences ̶ (Water Quality)
Cloud Computing-based Delivery of Drought Information at Multiple ScalesEnrique R. Vivoni, Arizona State University • Highlight: Scientists and engineers at ASU, CSUMB and Planetary Skin Institute teamed up to develop new cloud computing-based drought monitoring platform using satellite imagery and hydrologic modeling. • The PSI cloud computing platform provides decision makers with ready to use information on drought for assessing and tracking risk. • MODIS satellite data and NASA CASA hydrologic modeling provide new visualizations of drought for regions with limited information. • Relevance: Within the visualization platform (Fig. 1), integration of drought products from multiple sources and resolutions with ancillary GIS and remote sensing data provides context for drought occurrences, extents and severities. • Previously, countries in Latin America either had no drought monitoring or based estimtes of time since last rainfall. • With the drought monitor, stakeholders in Brazil and Mexico can visualize drought metrics that the country, basin or local scales. Figure 1:Cloud computing-based Drought Monitoring (v1.1) illustrating the prototype products for Brazil, including CASA model generated volumetric water content (VWC) anomalies for three months (May-July 2012) and MODIS generated water stress index (WSI) anomalies for six bi-weekly periods (May – July 2012). The PSI platform version shown here includes also country boundaries and satellite imagery. ESD Applied Sciences ̶ Water Resources
Enrique R. Vivoni, Arizona State University vivoni@asu.edu 480-727-3575 Project Summary: The goal of this project is to integrate drought information from remote sensing products and hydrologic models for use in data sparse regions of Latin America, specifically in Brazil and Mexico, but with global applicability. This is achieved within a cloud computing-based platform that allows decision makers the ability to explore, display and analyze the products within a web browser. Scientific Heritage: Drought monitoring from satellite platforms and hydrologic modeling has a heritage from vegetation stress studies of Moran et al. (1994) and modeling efforts by Potter et al. (1993). A major breakthrough in the delivery of drought information is the development of geographical, web-based tools that utilize cloud computing resources. This has provided the ability to allow stakeholders to integrate, display and analyze data themselves. Earth Science Data Products: The drought monitoring platform uses Earth Science observations from MODIS, AVHRR, data products from MERRA, NASA CASA and NASA CASA-Hydra models, and ancillary GIS data from FAO, CRU, GIAM and GRanD, among others. Technical Description of Figures: Figure 1: Cloud computing-based Drought Monitoring (v1.1) illustrating the prototype products for Brazil, including CASA model generated volumetric water content (VWC) anomalies for three months (May-July 2012) and MODIS generated water stress index (WSI) anomalies for six bi-weekly periods (May – July 2012). The PSI platform version shown here includes also country boundaries and satellite imagery. Application to ESDAS: Currently, the drought monitors in Latin America are either non-existent or rely on the number of days since last rainfall. This project brings together estimates of drought at high resolution at multiple scales from two main sources: remote sensing of water stress conditions in vegetation and hydrological modeling of soil conditions. The resulting products within a cloud computing-based platform are enhancing the abilities of decision-makers in Brazil and Mexico to readily access drought information. We expect this drought monitor will lead to more informed decision-making and linking of drought information to other management issues and risk assessments that are interrelated. References: Moran, M.S., Clarke, T.R., Inoue, Y. and Vidal, A. 1994. Estimating crop water deficit using the relation between surface air temperature and spectral vegetation index. Remote Sens. Environ., 49(3), 246-263. Potter, C. S., J. T. Randerson, C. B. Field, P. A. Matson, P. M. Vitousek, H. A. Mooney, and S. A. Klooster. 1993. Terrestrial ecosystem production: A process model based on global satellite and surface data. Global Biogeochemical Cycles, 7(4): 811-841. ESD Applied Sciences ̶ Water Resources
Assessing Water Resources in Remote, Sparsely Gauged, Snow-Dominated Mountain BasinsJeff Dozier, University of California, Santa Barbara &Robert E. Davis, US Army ERDC • Highlight: Scientists at University of California, Santa Barbara, combine data on snow-cover depletion from MODIS with an energy balance model driven by NLDAS data to reconstruct snow water equivalent (SWE). • SWE estimates from Reconstruction are more accurate than from the SNODAS model, as shown by comparison with snow pillows and streamflow. • However, Reconstruction is possible only after the snow is gone, whereas SNODAS analyses are in near real-time. • Relevance:Analyses of the Reconstruction and the model results will enable: • statistical estimation of patterns similar to Reconstruction, in real-time; • identification of sources of error in the SNODAS and similar models, and thereby help improve them. Figure 2. Snow water equivalent (mm) for the Sierra Nevada, California, from (left) SNODAS and (right) reconstruction from MODIS imagery and energy balance modeling. ESD Applied Sciences ̶ Water Resources
Other logo(s) Jeff Dozier, University of California, Santa Barbaradozier@bren.ucsb.edu(805) 563-2336 (mobile) Project Summary: Project goal is to estimate seasonal snow volumes, relative to historical trends and extremes, in snow-dominated mountains that have austere infrastructure, sparse gauging, challenges of accessibility, and emerging or enduring insecurity related to water resources. The analyses would help the US Army, US embassies, international, and non-profit organizations in regions where water resources affect US policy, martial and humanitarian operations, and national security. Scientific Heritage: Passive microwave data have a long heritage of estimating snow water equivalent, but accuracy is questionable in mountain areas. Reconstruction from optical imagery and energy balance modeling provides accurate estimates after the peak accumulation, but analyses are possible only after the snow has disappeared. Numerical weather models also estimate snowfall, but their accuracy is not verified. Earth Science Data Products:Snow water equivalent estimates from SSM/I. Snow cover estimates derived from MODIS and VIIRS. Energy balance models using data from GDAS and GLDAS. Large-scale estimates of water volume in snowpack from GRACE. Application to ESDAS-WR: The world's mountains accumulate substantial snow and, in some areas, produce the bulk of the runoff. In ranges like Afghanistan's Hindu Kush, availability of water resources affects US policy, martial and humanitarian operations, and national security. The rugged terrain makes surface measurements difficult and also affects the analysis of remotely sensed data. The analysis would leverage several techniques developed from NASA-sponsored research and use NASA instruments. While using data from the Sierra Nevada for validation, the activity would also improve water resource assessment in that region where statistically based forecasts occasionally produce significantly errors. References: Dozier, J. (2011). Mountain hydrology, snow color, and the fourth paradigm. Eos, Transactions American Geophysical Union, 92, 373-375, doi: 10.1029/2011EO430001. Frew, J.E., & Dozier, J. (2012). Environmental informatics. Annual Review of Environment and Resources, 37, 449-472, doi: 10.1146/annurev-environ-042711-121244. Rice, R., Bales, R.C., Painter, T.H., & Dozier, J. (2011). Snow water equivalent along elevation gradients in the Merced and Tuolumne River basins of the Sierra Nevada. Water Resources Research, 47, W08515, doi: 10.1029/2010wr009278. Rittger, K., Painter, T.H., & Dozier, J. (2012). Assessment of methods for mapping snow cover from MODIS. Advances in Water Resources, doi: 10.1016/j.advwatres.2012.03.002. ESD Applied Sciences ̶ Water Resources
Improving Water Supply and Drought Forecasts in CASteve Margulis, UCLA • Highlight: A reanalysis of snow water equivalent (SWE) over the Landsat 5 TM record (1985-2011) is being developed as a basis for deriving improved water supply forecast models in the Sierra Nevada basins of CA. • Landsat data provides long-term estimates of snow covered area over snow accumulation and snow melt season. • Use of Landsat data in combination with other NASA datasets allow for unprecedented space-time maps of SWE over ~30 year record. • Continuity of space-time maps provide complementary database to in situ network used in current forecasting methods. • Relevance: The forecasting of water supply in CA is made primarily using simple regression equations using historical in-situ SWE sensors. • The under-sampling of the true SWE fields by the sparse sensors leaves room for improvement in runoff forecasts (especially in dry years). • Leveraging spatially-distributed SWE datasets derived from NASA data allows for the potential of exploiting additional information for improving forecasts. Figure 1: Sample April 1st SWE (in units of meters) maps for the Feather River basin (90 m resolution) for the driest year (1987) and wettest year (1995) over the Landsat 5 record. These maps are derived using a novel reanalysis (data assimilation) scheme. The method has been applied for the whole Landsat 5 record (1987-2011). White areas are below snow line (1500 m). ESD Applied Sciences ̶ Water Resources
Steve Margulis (UCLA) margulis@seas.ucla.edu 310-267-5490 Project Summary: The goal of this project is to develop a new SWE reanalysis dataset based on NASA products in order to derive improved water supply forecast models. The application site is in the Sierra Nevada range in California. State, regional, and local agencies typically use in-situ data to derive simple regression-based water supply forecast models. The reanalysis will allow for improvement of these models, especially in drought years, when there is typically significant room for improvement. Scientific Heritage: Previous work by the PI/Co-PI developed the reanalysis technique used in this project (Durand et al., 2008; Girotto et al., 2012). The method assimilates snow covered area estimates from Landsat sensors into a land surface model to derive estimates of snow water equivalent at high spatial and temporal resolution. Earth Science Data Products: The primary Earth Science observations used in the work include static datasets (e.g. ASTER DEM, NLCD vegetation cover), dynamic meteorological forcing datasets (NASA NLDAS2), and Landsat 5 TM data (used to derive dynamic snow covered area maps). Additional data that could be used in the future include MERRA forcings and MODIS snow covered area datasets. Technical Description of Figures: Figure 1: The figure shows example output from the SWE reanalysis dataset for one of the two test basins, in this case the Feather River basin. Daily SWE estimates have been derived for the whole Landsat 5 record (1985-2011). Here examples of peak SWE (in units of meters) accumulation (i.e. on ~April 1st) are shown for the driest and wettest years in the record. The basin-average values as well as patterns can be used as inputs to improved forecast models. Application to ESDAS: The current forecasting system for water supply in CA relies exclusively on in situ SWE, precipitation, and runoff data. In general the snowmelt dominates the runoff signal, but the network of in-situ snow sensors are quite sparse. Spatially-distributed NASA data therefore has the potential for adding significant additional information to new forecasting frameworks. The value of the forecasts is estimated to be worth hundreds of millions of dollars so that improvements in forecasts could directly translate to significant societal and economic value. The spatially-distributed SWE estimates will be used in conjunction with end-user/stakeholder input to derive new forecast models. References: Durand, M., N. P. Molotch, and S. A. Margulis (2008), A Bayesian approach to snow water equivalent reconstruction, Journal of Geophysical Research, 113, D20117. Girotto, M., S. Margulis, M. Durand (2012), Probabilistic SWE reanalysis as a generalization of deterministic SWE reconstruction techniques, Hydrological Processes, under review. ESD Applied Sciences ̶ Water Resources
Adaptation Planning for Climate Change Impacts using Advanced Decision Support and Remote SensingCynthia Rosenzweig, NASA Goddard Institute for Space Studies • Highlight: Initial progress exploring the impacts of climate change on irrigated agriculture in the Central Valley of California includes: • Coupling of WEAP to DSSAT • Creation of current and future climate scenarios from BCCA and NARCCAP datasets • Deployment of WBM+ over contiguous United States • Relevance: This project will advance an integrative understanding of how water both constrains and provides opportunities for the agricultural sector. Specifically, it will: • Explore uncertainty in crop water use under climate change scenarios • Assess future water supply and demand in the Central Valley of California. • Improve the evaluation water supply impacts on future crop production in irrigated areas. • Place hydrologic changes in the Central Valley in a broader regional and continental context. • Evaluate the feasibility of using satellite precipitation observations to force hydrologic models instead of station observations. Figure 1:BCCA precipitation for 1980-1999 (top), difference between NARCCAP 2050-2069 and NARCCAP 1980-1999 precipitation (middle), North American runoff simulated by WBM+, including irrigation and reservoir operation (bottom). ESD Applied Sciences ̶ Water Resources
Cynthia Rosenzweig, NASA Goddard Institute for Space Studies cynthia.rosenzweig@nasa.gov 212-678-5562 Project Summary: This project explores current and future water availability for irrigation across the Central Valley and Western United States in collaboration with the US Bureau of Reclamation (USBR). Specifically, it is: (1) improving the representation of crops in hydrologic models, (2) simulating current and future available water throughout the Central Valley and distributions of water among competing uses, (3) assessing the impacts of future water availability on crop yields in irrigated agricultural areas, and (4) creating a regional framework of water resources for the broader western US. Scientific Heritage: This project builds crop and hydrologic modeling efforts, specifically the Water Evaluation and Planning System (WEAP; Yates et al., 2009), Water Balance Transport Model (WBM+; Vörösmarty et al., 1989), and Decision Support System for Agrotechnology Transfer (DSSAT), to create a a toolkit that is ideally suited for studying the impacts of climate change on agriculture and water resources in California’s Central Valley. Earth Science Data Products: The running and evaluation of the models listed above leverages several remote sensing datasets, including Tropical Rainfall Measuring Mission (TRMM) 3B42, Moderate Resolution Imaging Spectroradiometer (MODIS), and ENVISAT Advanced Synthetic Aperture Radar (ASAR). Technical Description of Figures: Figure 1: Bias-Corrected with Constructed Analogues (Maurer et al., 2010) precipitation for 1980-1999 (top), difference between NARCCAP (Mearns et al., 2009) 2050-2069 and NARCCAP 1980-1999 precipitation (middle), and North American runoff simulated by WBM+ forced by GFDL-ESM2M statistically downscaled and bias-corrected by the Intersectoral Impacts Model Intercomparison Project (ISI-MIP), including irrigation and reservoir operation (bottom). Application to ESDAS: This project directly contributes to several Applied Sciences Program objectives. It enables near-term uses of Earth science by assessing the impacts of climate change on California’s $35-billion agricultural sector, transitions applied knowledge to public and private organizations by incorporating new models and methods into existing USBR decision-making tools, and integrates Earth science and satellite observations in organizations’ services by exploring the use of TRMM 3B42 in hydrologic models. References: Maurer, E.P., H.G. Hidalgo, T. Das, M.D. Dettinger, and D.R. Cayan, 2010, 'The utility of daily large-scale climate data in the assessment of climate change impacts on daily streamflow in California', Hydrology and Earth System Sciences, 14, 1125-1138. Mearns, L.O., W. J. Gutowski, R. Jones, L.-Y. Leung, S. McGinnis, A.M.B. Nunes, and Y. Qian, 2009: A regional climate change assessment program for North America. Eos, 90, 311-312. Vörösmarty, C.J., B. Moore III, A.L. Grace, M. Gildea, J.M. Melillo, B.J. Peterson, E.B. Rastetter, and P.A. Steudler, 1989: Continental scale models of water balance and fluvial transport: An application to South America, Global Biochemical Cycles, 3, 241-265. Yates, D., D. Purkey, J. Sieber, A. Huber-Lee, H. Galbraith, J. West, S. Herrod-Julius, C. Young, B.A. Joyce, and M. Al Raey, 2009: A Climate-Driven Water Resources Model of the Sacramento Basin, California. Journal of Water Resources Planning and Management, 135(5), 303-313. ESD Applied Sciences ̶ Water Resources
NASA Snow Research in NWS Hydrological Decision SupportGreg Fall, NOAA National Operational Hydrologic Remote Sensing Center • Highlight: NOHRSC and CREW, with the partnership of GSFC scientists and Alaska-Pacific River Forecast Center (APRFC) hydrologists, established routine real-time land surface modeling capabilities for Alaska, where comprehensive snow information has heretofore been unavailable. Essential features of the effort: • The modeling domain is a 42° × 24° geographic grid at 0.01° spatial resolution. • Two sets of model forcing data (GDAS and NAM) and two LIS land surface models (CLM 2.0 and Noah 3.2) comprise a 4-member ensemble. • Our primary stakeholder interaction occurs via regular meetings with the APRFC during the spring snow melt. Figure 1: Modeled snow water equivalent for 28 March 2013. • Relevance: • The gridded real-time snow information provided as a result of this project now participates directly in snowpack evaluation and analysis at the APRFC. • Ground and airborne snow survey data collected during the melt season are important for contextualizing and confirming model results, but are no longer the sole source of snow information for the region. Figure 2: Sample SNOTEL time series from the NOHRSC interactive website. ESD Applied Sciences ̶ Water Resources
Greg Fall, NOAA National Operational Hydrologic Remote Sensing Center Gregory.Fall@noaa.gov 952-368-2518 Project Summary: This project transferred NASA research results—namely, the Land Information System (LIS) framework and its models—into NOAA’s operational snow decision support framework, the Snow Data Assimilation System (SNODAS). The system was implemented over the Alaska region, providing high resolution gridded snow states to the Alaska-Pacific River Forecast Center (APRFC) for use in their water management and disaster management activities, as well as to the general public. Scientific Heritage: The Land Information System combines and extends the land surface simulation and data assimilation capabilities of its precursors: the Global Data Assimilation System (GLDAS, Rodell et al., 2004) and the North American Land Data Assimilation System (NLDAS, Mitchell et al., 2004), creating a modeling framework that supports high-performance parallel and distributed computing (Peters-Lidard et al., 2007). Earth Science Data Products: This project utilizes numerical weather prediction model data from NOAA’s National Center for Environmental Prediction (GDAS and NAM systems) to drive two community land surface models (CLM and Noah) in the LIS land surface modeling and data assimilation system developed at NASA-GSFC. MODIS snow cover products are a key element of data assimilation during model spin-up as well as routine validation. Technical Description of Figures: Figure 1: The Alaska modeling domain is shown as a red outline, with an overlay of modeled NAM + CLM snow water equivalent for 28 March 2013. Four NWP + LSM combinations are available: NAM + CLM, NAM + Noah, GDAS + CLM, GDAS + Noah. Systematic inaccuracies and differences among the four illustrate the need for snow data assimilation and further evaluation of both model forcings and essential parameter data sets. Figure 2: Time series plot from the NOHRSC interactive website comparing modeled snow from the NAM + Noah model with observations at a SNOTEL site in north central Alaska, for the first three months of 2013. At this site the modeled accumulation of snow water equivalent is quite consistent with observations, though the modeled snowpack is less dense than the observed snow. Evaporative losses in the model are not reflected in the observations; consequently, by late March the modeled snowpack is greatly reduced relative to the observations. Application to ESDAS: The ability of hydrologists at the APRFC to now consider a suite of gridded, high resolution modeled snowpack states along with their traditional sources of snow information (primarily ground and airborne surveys, accurate and targeted but quite limited in scope) represents a significant enhancement in capability. Our regular interaction with them provides clarification and verification of the impressions they gain from working with model data, and their subsequent interaction with citizens and policymakers in the field benefits directly from this collaboration. References: Mitchell, K. E., D. Lohmann, P. R. Houser, E. F. Wood, J. C. Schaake, A. Robock, B. A. Cosgrove, J. Sheffield, Q. Duan, L. Luo, R. W. Higgins, R. T. Pinker, J. D. Tarpley, D. P. Lettenmaier, C. H. Marshall, J. K. Entin, M. Pan, W. Shi, V. Koren, J. Meng, B. H. Ramsay, and A. A. Bailey, 2004: The Multi-institution North American Land Data Assimilation System (NLDAS): utilization of multiple GCIP products and partners in a continental distributed hydrological modeling system. Journal of Geophysical Research, 109, DOI: 10.1029/2003JD003823 Peters-Lidard, C. D., P. R. Houser, Y. Tian, S. V. Kumar, J. Geiger, S. Olden, L. Lighty, B. Doty, P. Dirmeyer, J. Adams, K. Mitchell, E. F. Wood, and J. Sheffield, 2007: High-performance Earth system modeling with NASA/GSFC’s Land Information System. Innovations in Systems and Software Engineering, 3, 157-165. DOI: 10.1007/s11334-007-0028-x Rodell, M., P. R. Houser, U. Jambor, J. Gottschalck, K. Mitchell, C.-J. Meng, K. Arsenault, B. Cosgrove, J. Radakovich, M. Bosilovich, J. K. Entin, J. P. Walker, D. Lohmann, and D. Toll, 2004: The Global Land Data Assimilation System. Bulletin of the American Meteorological Society, 85, 381-394. DOI: 10.1175/BAMS-85-3-381 ESD Applied Sciences ̶ Water Resources
NASA’s Project Nile maps agroecosystems of the Blue Nile Belay Simane (Addis Ababa University), Ben Zaitchik (Johns Hopkins University), MutluOzdogan (University of Wisconsin) Highlight: In the diverse terrain of the Blue Nile Highlands it can be difficult to perform a complete survey of agricultural potential. In this project, NASA Project Nile researchers partnered with an Ethiopian agronomist to generate an objective, satellite-informed map of agroecosystems of Choke Mountain, at the heart of the Blue Nile Highlands. The map replicates and extends on the results of time consuming traditional agroecological survey. • Relevance: • The Blue Nile Highlands are currently facing combined pressures of population growth, low agricultural productivity, and climate change. Development interventions intended to enhance climate resilience and reduce soil erosion are difficult to design and to scale up because climate, hydrology, and soils are so diverse across the region. Objective mapping techniques like those applied in this study can be used to target development strategies in a manner that improves their likelihood of success and allows lessons learned in one location to be applied to similar locations across the landscape. • In the Blue Nile, effectively targeted land management is important both for local development and for enhancing downstream water value in the Nile River system. Figure 1: The Blue Nile Highlands, with detail of topography in the Choke Mountain study area. Figure 2: The six agroecosystems defined for Choke Mountain, ranging from the hot, dry sorghum-growing region in the Blue Nile gorge (AES1) to the afroalpine natural zone at the mountain summit (AES6). Between are the intensive tef-growing region represented by AES2, the productive maize and wheat zone (AES3), the less productive wheat and barley zone (AES4), and the low productivity barley zone (AES5). ESD Applied Sciences ̶ (Insert focus area here)
Ben Zaitchik, Johns Hopkins Universityzaitchik@jhu.edu 410-516-4223 Project Summary: The goal of this study, a sub-activity of Project Nile, is to implement a technique for objective mapping of farming systems and agricultural potential across the Blue Nile Highlands, in order to inform the implementation of appropriate soil conservation and climate adaptation practices. Scientific Heritage: The project depended on multiple satellite-derived products and on the output of the Nile Land Data Assimilation System (Nile-LDAS; Zaitchik et al., 2012), a land surface modeling system customized for the Nile Basin that is based on the NASA Land Information System (LIS) software framework (Kumar et al., 2006). Earth Science Data Products: This project makes use of TRMM Multisensor Precipitation Analysis (TMPA) precipitation estimates, Shuttle Radar Topography Mission (SRTM) information on elevation and slope, MODIS-derived vegetation indices, and distributed hydrometeorological fields downscaled and simulated by Nile-LDAS. Technical Description of Figures: Figure 1: A topographic background map. The Blue Nile Basin is outlined in red, and topographic data are from the Shuttle Radar Topography Mission. Figure 2:This objective classification of agroecosystems was generated using a statistical modeling technique called Random Forests, which ingests gridded biophysical information from satellites and Nile LDAS along with field observations of cropping systems to generate an objective mapping of agricultural ecosystems (or “agroecosystems”). The analysis was performed at 90m resolution, to take advantage of the full available resolution of SRTM, but Nile-LDAS inputs were generated at 5km resolution. Application to ESDAS-WR: Reducing soil erosion in the Blue Nile Highlands is a critical water resource priority for Ethiopia, due to concerns about siltation of new hydroelectric projects, and to Sudan, on account of the expensive dredging projects required to remove sediment from reservoirs and irrigation projects. The agroecosystem classification performed in this study is designed to inform more effective deployment of soil management techniques in the Blue Nile Highlands while informing strategies for more resilient agriculture—and therefore less land use pressure and erosion—under changing climate conditions. For this reason, the project has encouraged significant stakeholder engagement from local to transboundary scale. In doing so, the agroecosystem mapping project has advanced the broader NASA Project Nile goal of generating new hydrologic information to inform land and water management in the Nile basin. Applying earth observations to this purpose is consistent with the core objectives of ESDAS-WR. References: Kumar SV, and Coauthors (2006) Land information system: An interoperable framework for high resolution land surface modeling. Environmental Modelling & Software 21: 1402-1415. Simane B, BF Zaitchik and M Ozdogan (2013) Agroecosystem analysis of the Choke Mountain watersheds, Ethiopia. Sustainability 5(2): 592-616; doi:10.3390/su5020592 Zaitchik BF, B Simane, S Habib, MC Anderson, M Ozdogan, and JD Foltz (2012) Building Climate Resilience in the Blue Nile/Abay Highlands--A role for Earth System Sciences. Int. J. Env. Res. Pub. Health 9(2): 435-461; doi:10.3390/ijerph9020435 ESD Applied Sciences ̶ Water Resources
The Global Reservoir and Lake MonitorCharon Birkett (UMD), Curt Reynolds (USDA/FAS), Brian Beckley+Christa Peters Lidard (NASA/GSFC) • Highlight: • The GRLM outputs water-level products for the world’s largest lakes and reservoirs in regions of significant agricultural and water resources importance. • The information is derived from NASA/CNES or ESA suites of satellite radar altimeters. • .Recently the products derived from NASA/CNES instruments underwent revision, upgrading them to improve quality and quantity of information (see right). • Relevance: • Satellite-derived water-levels assist decision makers in the assessment and monitoring of regional drought. Such information aids estimation of water resources, irrigation potential, and determines any potential threats to regional security in extreme cases. • The satellite products supplement ground-based gauge data or provide a new data source for those regions lacking adequate gauge monitoring or reporting. • .Fast delivery of satellite data allows for operational use of the products, and long-term monitoring allows for the assessment of regional hydrological and anthropogenic trends. Figure 1: Figure shows the recent upgrade of lake level products as derived from the NASA/CNES suite of radar altimeters. The plots show the 1992-2012 status of water level in the Salton Sea. (Left) the original TPJO.1 product derived from the Topex (blue) and Jason (red and purple) altimeters. Top plot is the raw result, bottom plot is a filtered version to aid visualization. Note the lack of Jason-1 results (red). (Right) the new TPJO.2 product based on a revised, higher resolution, lake level datum, resulting in much improved Jason information. ESD Applied Sciences ̶ Water Resources/Drought
Dr Charon Birkett, University of Maryland College Park cmb@essic.umd.edu Tel: 301 405 9296 Project Summary: Scientific Heritage: NASA and ESA funding allowed for the investigation of satellite radar altimetry techniques and data sets over ocean surfaces and continental waters. This success led to the NASA-funded Pathfinder project which delivered sea-level products to end-users, and it also led to a pilot program delivering archival lake and reservoir water-level products to the United Nations Development Program. Earth Science Data Products: Surface water levels products for large lakes, reservoirs and inland seas, derived via the use of NASA/CNES (Topex/Poseidon, Jason-1, Jason-2), Naval Research Lab (GFO), and ESA (ERS, ENVISAT) radar altimeter data sets. Technical Description of Figures: Figure 1: A time series of relative lake level variations for Lake Guri, Venezuela. The product has been derived using data from the Topex (blue) and Jason (red and purple) series of NASA/CNES satellite. Raw results are display at the top, filtered or smoothed results to aid visualization are below. Accuracy is estimated to be 10-20cm rms. Application to ESDAS: Project provides value-added utilization of satellite radar altimetry data beyond the traditional ocean/ice-sheet monitoring objectives. Program utilizes remote sensing data for global observations, thus enhancing ground-based networks or creating new data sources. Well validated techniques, excellent data sets, and fast delivery of data enables operational monitoring for applied interdisciplinary projects. GRLM is significant in the provision of lake level products where in situ data is not available. Enables stakeholders to observe long-term drought, to monitor recovery from historical drought, to assess flood status or low-water ‘dead levels’, and allows end-users to make near real time water management decisions and to assess irrigation potential for regional crop production. References: Birkett, C.M., 1998, Contribution of the TOPEX NASA radar altimeter to the global monitoring of large rivers and wetlands, Water Resources Research, 34, No.5, pp.1223-1239. Birkett, 2010, ‘Lake Levels’, in State of the Climate in 2009, Chapter 2. Global Climate, Section 3 Hydrological cycle, editors D.S. Arndt, M.O. Baringer and M.R.Johnson, Bulletin of the American Meteorological Society, 91(7), 38-39. Birkett, C.M., Reynolds, C., Beckley, B and B. Doorn, 2010, From Research to Operations: The USDA Global Reservoir and Lake Monitor, Chapter 2 in ‘Coastal Altimetry’, eds. S. Vignudelli, A.G. Kostianoy, P. Cipollini and J. Benveniste, Springer Publications, ISBN 978-3-642-12795-3. Birkett, C.M., Beckley, B., 2010, Investigating the Performance of the Jason-2/OSTM radar altimeter over Lakes and Reservoirs, Jason-2/OSTM Special Issue, Journal of Marine Geodesy, 33(1), pp.204-238. ESD Applied Sciences ̶ (Water Resources/Drought)