Download
1 / 35
360 likes | 515 Views
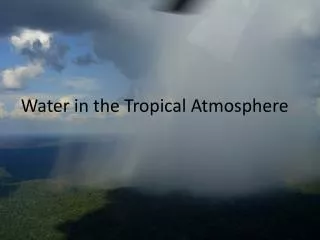
Water in the Tropical Atmosphere. The importance of the hydrological cycle in our planet. Clouds reflect solar radiation back to space resulting in low solar incoming radiation available to heat the surface.

E N D
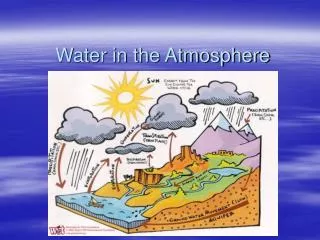
The importance of the hydrological cycle in our planet Clouds reflect solar radiation back to space resulting in low solar incoming radiation available to heat the surface Condensation releases Latent Heat to the atmosphere: main driving forces for tropical disturbances Rainfall returns to the ground, is transported by rivers, used by the biosphere and can evaporate and re-enter the atmosphere Evaporation of water: transport heat from the surface to upper levels within the updrafts (ascending currents)
Evapotranspiration • Atmospheric moisture originates from the earth’s surface, where water is in its liquid or solid phase and is transformed into water vapor • Water vapor can be transported vertically (ascending currents) or horizontally (winds)
Water vapor originates from two processes: evaporation and evapotranspiration Evaporation takes place from water, ice surfaces (even in tropical regions!) , soil and over land, rocks or vegetation that are wet after rainfall E ET E ET E T Transpiration: is the same process as evaporation but carried out by organisms, mainly plantsThe combination of Transpiration + Evaporation =evapotranspiration Evapotranspirationindicates the total flow of water vapor into the atmosphere. Symbols: E= evaporation, ET=evapotranspiration ; T= transpiration
transpiration The roots of plants remove water from the soil water evaporates from leaf surface Rainforests like the Amazon represent a large source of transpiration and evaporation (evapotranspiration) to the atmosphere
What controls evapotranspiration • 1) The capacity of the air to take up water vapor • 2) the amount of energy available for use in the evaporation and transpiration processes • 3) degree of turbulence at the lower layers of the atmosphere necessary to transfer the water vapor near surface to higher levels in the atmosphere.
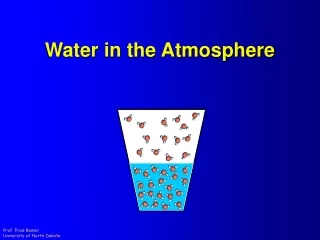
1) The air capacity to take up water vapor Suppose that circles represent water vapor molecules Saturation for a given Temperature T is reached when evaporation rate equals the condensation rate. If one molecule evaporates another will condensate Evaporation Condens Rate Rate
1) The air capacity to take up water vapor Saturation water vapor pressure and temperature relationships • This figure shows the relationships between the maximum quantity of water vapor that can be observed at a given temperature T (oC). • For each temperature, there is a maximum vapor pressure that can be observed with respect to a surface of water • This figure indicates that the capacity of air to retain moisture increases rapidly with temperature • Warm tropical masses can take up more water vapor than cold ones Larger difference 5oC 5oC Warm climates Cold climates
1) The air capacity to take up water vapor • The actual amount that can be absorbed into the atmosphere also depends on the humidity of the air. The lower it is, the more favorable are the conditions for further evaporation. • The dry tropics have very high rates of evaporation (importance of the semi-permanent anticyclones over the oceans)
2) The energy for evapotranspiration is provided by solar radiation: available in large quantities in the tropics World Daily Solar InsolationMap ( from : http://www.oksolar.com/abctech/solar-radiation.htm)This map shows the amount of solar energy in hours, received each day on an optimally tilted surface (as determined by engineers when solar panels are installed) during the worst month of the year (note how cloudiness are important in tropical regions!).
3) Turbulence in the atmosphere • Turbulence depends on horizontal winds and also on convection (vertical currents) • Winds can be weak too close to the equator but convection can be strong in this regions. • Trade winds can be very strong in some seasons and some years and increase evaporation.
Annual distribution of evaporation • Note how evaporation is larger over tropical oceans (dominated by anti-cyclones) when compared with forested regions such as the Amazon (large amount of rainfall) • Deserts are regions with low clouds but low available moisture to evaporate • Remember also that high annual evaporation depends also on the availability of moisture on the ground! Dry deserts have all ingredients for high evaporation (solar radiation, winds, turbulence, low humidity) but have no water to evaporate (200mm/year)!
Comparison: precipitation and evaporation rates (distinct unities) cm/year H H • Highest values of evaporation (~ 2000mm/yr) occur over the subtropical oceans where the subtropical anticyclones dominate in both hemispheres. That is, evaporation exceeds precipitation: ocean deserts • Evaporation rates are high where warm ocean currents exist (Gulf Stream – SE North America, Kuroshiro – SE Japan) (~ 2000mm year) • Where cold currents dominate (off the west coasts of Africa and South America) evaporation rates are less than 1000mm/year
Why low evaporation rates occur in oceanic equatorial regions? Answer: in these regions precipitation dominate, cloud cover is high, air masses are often at or near saturation, wind velocities are low and in some regions upwelling of cold water is also observed. All these factors operate to reduce evaporation rates
Meridional distribution of evaporation over the oceans Little seasonal variation at the Equator Trades are stronger in the winter Hemisphere: rate of evaporation increases
In contrast, land evaporation rates are highest for the equatorial regions, why? ~ 1200mm Answer: high temperature (more important) and high precipitation rates (source of moisture)
In conclusion: What drives evapotranspiration: • High energy (high temperatures) • Humidity in the atmosphere • Turbulence (convection and winds) • Moisture availability
Over water surfaces, where supply is plentiful, evaporation is not restricted and the values reached are called “potential evaporation”Over land areas, the actual evaporation is less than the potential except where rainforests exist (such as in the Amazon) IR 11/19/2009 0000Z IR 11/19/2009 0000Z Global Average over land: 480 mm/year; Over oceans: 1176mm/year
Humidity • The outcome of the evaporation process is the vertical transfer of moisture away from the earth’s surface to the atmosphere • This result in the increase in the atmospheric water vapor level • This process transfers mass and energy (evaporation takes heat from the environment and transport to upper levels) => LATENT HEAT TRANSFER
Humidity can be expressed in a variety of ways The simplest and most widely used instrument for measuring humidity is the sling psychrometer, which has two thermometers called the wet bulb and dry bulb. The difference between the two temperatures, the wet bulb depression, depends on the moisture content of the air and can be used to determine dew point and relative humidity.
Absolute humidity is the density of water vapor (‘red circles’), expressed as the number of grams of water vapor contained in a cubic meter of air (blue circles)= (g/m3)
The mixing ratio is a measure of the mass of water vapor (red) relative to the mass of the other gases of the atmosphere (dry air in blue) (g/kg)
The maximum possible mixing ratio is called the saturation mixing ratio. (g/kg) Saturation specific humidity is the maximum specific humidity that can exist at a given temperature and is directly analogous to the saturation vapor pressure.
Relative humidity, RH, relates the ACTUAL amount of water vapor in the air to the maximum possible at the current temperature. RH = (specific humidity/saturation specific humidity) X 100% Saturation for cold air More water vapor can exist in warm air than in cold air, so relative humidity depends on both the actual moisture content and the air temperature. Saturation for warm air If the air temperature increases, more water vapor can exist, and the ratio of the amount of water vapor in the air relative to saturation decreases.
More on moisture in the atmosphere:http://www.icess.ucsb.edu/clivac/classes/geog110.htmclass on atmospheric moisture
Mean annual specific humidity (g/kg) ( g water/ Kg dry air) • Increase as latitude decreases • Large values where tropical rain forests are present • Extratopical continental regions have less specific humidity than oceans for the same latitude • Arctic and Antarctica are very dry regions (drier than the Sahara desert)
January minus July specific humidity g/kg • Question for Debate: Explain the reasons for relatively larger differences of specific humidity between January and over eastern USA, West Africa, Northern Australia and Eastern Asia. • Why seasonal differences in moisture are not as large over low latitudes in South America?
Winter NH (January) Summer NH (July) You can justify your answers based on the seasonal variation of moisture (Differences are for January – July)
Winter NH (January) Summer NH (July) • Moisture is transported from the anticyclone regions over the oceans toward the continents during summer of the respective hemisphere over Africa, Asia and south eastern USA • Near the equator over South America The South Atlantic Antycyclone provides moisture during the winter decreasing the seasonal differences
Mean annual meridional transfer of water vapor in the atmosphere (in 1015 kg) NE trades SE trades SE trades transport a great mass of water vapor compared to the NE trades. Note that the peak is ~ 10S and 10-15N 3) Question for debate: explain the reasons (mechanisms) for the meridional transport of moisture to midlatitudes of both hemispheres.
Precipitation versus evaporation: negative values of divergence of water vapor indicates precipitation > evaporation and positive values evaporation > precipitation June to August December to February E+ P+ E+ E+ E+ P+ E+ E+ P+ P+ P+ P+ P+ P+ P+ P+ E+ E+ P+ E+ E+ E+
Clouds in tropical regions: Low level: Stratocumulus Sc Low level: Stratus St Low level: Nimbostratus Ns Mid level: Altostratus As Trade wind cumulus Cu Cumulonimbus Cb High level Cirrus Ci
Meridional profile of cloud amountsWhat are the most important clouds (regarding frequency and cover) for tropical oceans? 2) Low level St (satellite picture) July -Aug Dec-Feb 1)Mid level: Altostratus As 3) cumulus Cu 4) Cirrus (Ci) Question: Is the Northern Hemisphere to the right or left with respect to the equator in the horizontal axes of these figures and why?
Meridional profile of cloud amounts: continents Dec-Feb 2) Low level St (satellite picture) July -Aug 1)Mid level: Altostratus As 3) cumulus Cu 2) Cirrus (Ci)
What are the main conclusions regarding: • The importance of water vapor • Controls of evapotranspiration • Annual distribution of evaporation • Importance of anti-cyclones over the oceans • Trade winds and evaporation • Meridional transport of water vapor • Relationship precipitation/evaporation • Cloud distribution in tropical regions