Perceptual Systems
Perceptual Systems. Sources: Wolfe, J, Kluender , K, Levi, D. et al Sensation & Perception 2012 3 rd ed Sinauer – 15% discount and free shipping if ordering online from Sinauer Kandel , Schwartz & Jessel Principles of Neural Science McGraw-Hill 5 th ed

Perceptual Systems
E N D
Presentation Transcript
Sources: Wolfe, J, Kluender, K, Levi, D. et al Sensation & Perception 2012 3rdedSinauer – 15% discount and free shipping if ordering online from Sinauer Kandel, Schwartz & Jessel Principles of Neural Science McGraw-Hill 5thed Gazzaniga, Ivry, Mangun Cognitive Neuroscience Norton, 3rded Readings, Class 1: Wolfe Ch 1,2 Kandell et al Chapters 26
Visual Perception: what do we want to explain? How do we get visual information from the world and use it to control behavior? Traditional sub-areas - visual sensitivity color vision spatial vision temporal vision binocular vision/ depth perception texture perception motion perception surfaces, segmentation object perception attention perceptual learning spatial orientation eye movements
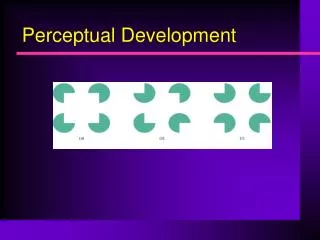
The constructive nature of perception: a process of guessing the state of the world from sometimes incomplete sensory data. Constructive in the sense that it relies on memory representations of past experience
Major transformations of the light signal in the retina: Temporal filtering – visual response slower than input signal. 2. Spatial filtering – local signals are combined across space to varying degrees. 3. Light adaptation – retina modifies responsiveness depending on average light level. Color coding– trichromacy and color opponency
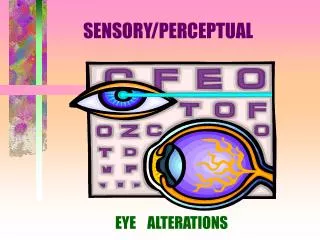
The Eye and Retina iris pupil Pigment epithelium reduces scatter Important vegetative functions Note – blind spot - cf damage to peripheral retina Visualize retinal blood vessels.
Visual Angle x a d tan(a/2) = x/d a = 2 tan-1 x/d Most of the optical power of the eye is accomplished by the cornea 18mm 1 diopter = 1/focal length in meters 55 diopters = 1/.018 0.3mm = 1 deg visual angle
Optical correction errors Blur circle Presbyopia = stiffening of lens with age so it is no longer variable
Figure 2.9 Photoreceptor density across the retina Note: peripheral cones are fatter. Rods similar to foveal cones Note: color vision in peripheral retina
Visual Acuity matches photoreceptor density Relative visual acuity Receptor density 1 foveal cone= 0.5 min arc
Two of the factors limiting visual acuity are • - optics of the eye • - size and spacing of photoreceptors • (in central fovea, a cone is about 0.5 min arc) • Grating versus vernier acuity: Snellen (letter chart versus • threading a needle)
Vernier acuity is an order of magnitude better than grating acuity. How can this be? Sine wave gratings Acuity is the highest frequency pattern that is just visible – ie the narrowest stripes A similar measure is made by the Snellen letter chart: E
Figure 2.9 Photoreceptor density across the retina Question: Rods are small and dense. Why isn’t acuity better in the peripheral retina?
Transduction: light into electrical signals “dark light” Note sluggish response
Major transformations of the light signal in the retina: Temporal filtering – visual response slower than input signal. photoreceptor response is slow – increases sensitivity 2. Spatial filtering – local signals are combined across space to varying degrees. Acuity for fine patterns determined by optics and photoreceptor layout. 3. Light adaptation – retina modifies responsiveness depending on average light level. Color coding– trichromacy and color opponency
Probability of absorption of a photon depends on wavelength (but receptor doesn’t know what wavelength it absorbed)
Note: peak sensitivity in day about the same wavelength as maximum output of sun. Peak night day Why blue flowers are brighter and red flowers are darker at dusk.
Midget system preserves acuity in the central fovea M= magnocellular, P= Parvocellular Convergence: many rods converge onto a single rod bipolar cell, and several cones converge onto a diffuse bipolar cell. This allows the signal to be amplified.
Horizontal and amacrine cells form inhibitory surrounds of ganglion cells. Why ON and OFF cells?
Hecht, Schlaer, & Pirenne, 1942 A single quantum is sufficient to excite a rod photoreceptor. A few quanta within a small area is sufficient to give a sensation of light. Measure number of quanta for a just detectable sensation of light – about 100 quanta. Of those 100 quanta, about 90 are lost on the way to the retina form scatter in the eye. So 10 quanta incident on the retina lead to a sensation of light. Light has a Poisson distribution, so the probability that more than one photon falls on a single rod is very small. Therefore, a single photon must excite a rod, and 10 photons excite a retinal ganglion cell. This signal is transmitted to the brain with minimal loss and generates a sensation of light.
Center-surround organization of bipolar and ganglion cells Light spot excites cell Dark spot excites cell Biggest response to a spot in center Center-surround organization means that responses to uniform lights are reduced
Figure 3.6 Sine wave gratings illustrating low (a), medium (b), and high (c) spatial frequencies These grating stimuli are called “Gabor patches”. Spatial frequency is measured in Cycles per degree, and contrast is a measure of the difference in intensity between light and dark bars.
Figure 3.7 The contrast sensitivity function (red line): the window of visibility
Perceptual consequences of center surround antagonism Brightness is coded by the differences in illumination between adjoining regions This results from center-surround organization.
Perceptual consequences of center surround antagonism Brightness is coded by the differences in illumination between adjoining regions
Major transformations of the light signal in the retina: Temporal filtering – reduced response to high temporal frequencies – Temporal integration – a strong 1 msec flash is equivalent to a weaker 50 msec flash. 2. Spatial filtering: - Anatomical organization of photoreceptors provides high acuity in fovea with rapid fall-off in the periphery. (photoreceptor density) -Convergence of photoreceptors onto ganglion cells also leads to acuity limitations in the peripheral retina. (1 cone per midget cell in fovea) - Center-surround antagonism reduces sensitivity to uniform fields. 3. Light adaptation Color coding
Light adaptation: the problem Need to respond over a range of 1010 – but ganglion cells can only signal 0-200 spikes/sec Ganglion cells change sensitivity as well as photoreceptors. Response on different background intensities tvi curve ΔI/I = 1 Receptor adaptation Perceptual consequence of light adaptation: hard to tell ambient light intensity
Loss of sensitivity at low temporal frequencies (slow rate of change of intensity) is a consequence of light adaptation (sensitivity changes with average light level) (afterimage fading)
Figure 2.17 Dark adaptation curve Sensitivity recovers when the retina is in the dark, rapidly for cones, slowly for rods. (afterimages)
Major transformations of the light signal in the retina: Temporal filtering – reduced response to high temporal frequencies – Temporal integration – a strong 1 msec flash is equivalent to a weaker 50 msec flash. 2. Spatial filtering: - Anatomical organization of photoreceptors provides high acuity in fovea with rapid fall-off in the periphery. (photoreceptor density) -Convergence of photoreceptors onto ganglion cells also leads to acuity limitations in the peripheral retina. (1 cone per midget cell in fovea) - Center-surround antagonism reduces sensitivity to uniform fields. 3. Light adaptation – sensitivity regulation - adjustment of operating range to mean light level. (Light level 1010 range, ganglion cells, 102 range.) Color opponency. Organization of 3 cone photoreceptors into color opponent signals (Luminance, Red-Green, Yellow-Blue)
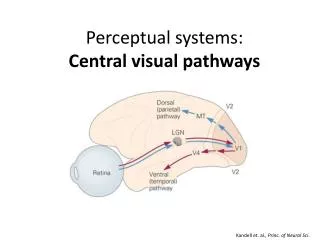
Retinotopic Organization and Cortical Magnification The brain uses more physical space for signals from the fovea than the periphery Adjacent points in the world Project to adjacent points in cortex
Signals from each eye are adjacent in LGN but remain segregated in different layers. Convergence occurs in V1. Two kinds of cells in retina project to different layers in LGN M=magno=big P=parvo=small K= konio
Magno and parvo cells have different spatial and temporal sensitivities. Function of the different M and P pathways is unclear. Note: attempts to Isolate a pathway psychophysically were unsuccessful
Cone Photoreceptors are densely packed in the central fovea Note: despite lower density of cones in peripheral retina, color vision is basically the same across the visual field.
Figure 2.11 Blue, green, and red represent the S-, M-, and L-cones, respectively, of a living human being in a patch of retina at 1 degree from the fovea • Two of the factors limiting visual acuity are • – optics of the eye • size and spacing of photoreceptors • (in central fovea, a cone is about 0.5 min arc)