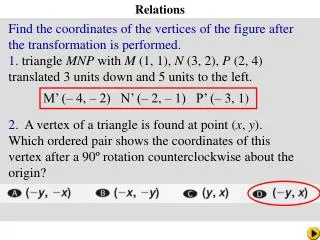
Math Pacing
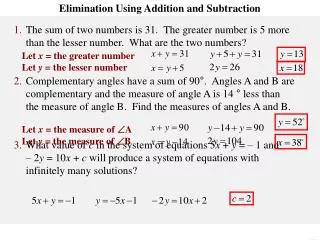
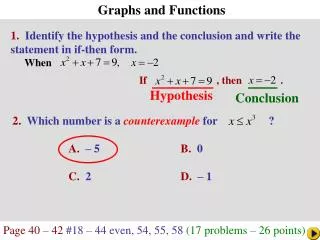
Graphs and Functions. If , then . Math Pacing. 1. Identify the hypothesis and the conclusion and write the statement in if-then form. When. Hypothesis. Conclusion. 2. Which number is a counterexample for ? A. – 5 B. 0 C. 2 D. – 1.

Math Pacing
E N D
Presentation Transcript
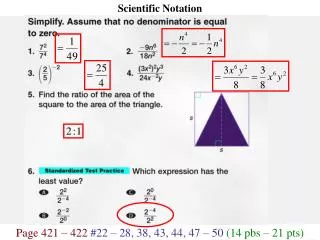
Graphs and Functions If , then . Math Pacing • 1. Identify the hypothesis and the conclusion and write the statement in if-then form. • When Hypothesis Conclusion • 2. Which number is a counterexample for ? • A. – 5 B. 0 • C. 2 D. – 1 Page 40 – 42 #18 – 44 even, 54, 55, 58 (17 problems – 26 points)
Graphs and Functions PEMDAS A function is a relationship between input and output. In a function, the output depends on the input. There is exactly one output for each input.
6 5 4 3 2 1 The vertical number line is called the y-axis. The coordinate system is also called the coordinate plane. 0 9 8 7 6 5 4 3 2 1 1 2 3 4 5 6 7 8 9 1 2 3 4 5 6 The origin is at (0, 0), the point at which the number lines intersect. The horizontal number line is called the x-axis.
Graphs and Functions An ordered pair of numbers is used to locate any point on a coordinate plane. The first number is called the x-coordinate. The second number is called the y-coordinate. (3, 2) The x-coordinate corresponds to a number on the x-axis. The y-coordinate corresponds to a number on the y-axis. Copy the ordered pair and labels into your notes.
Identify Coordinates Example 8-1a Sports Medicine Name the ordered pair at point E and explain what it represents. Answer: Point E is at 6 along the x-axis and 100 along the y-axis. So, its ordered pair is (6, 100). This represents 100% normal blood flow 6 days after the injury.
Identify Coordinates Example 8-1b Name the ordered pair at point D and explain what it represents. Answer: (4, 97)This represents 97% normal blood flow 4 days after the injury.
Graphs and Functions In this example, the percent of normal blood flow depends on the number of days from injury. Therefore, the number of days from injury is called the independent variable or quantity and the percent of normal blood flow is called the dependent variable.
Graphs and Functions TITLE y 36 32 28 24 20 16 12 8 4 y-axis label x 0 1 2 3 4 5 6 7 8 9 x-axis label dependent variable independent variable Copy this into your notes.
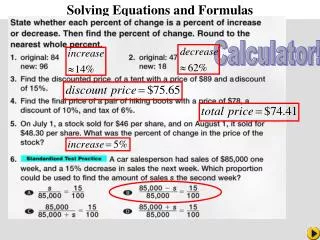
Independent and Dependent Variables Example 8-2a Energy In warm climates, the average amount of electricity used in homes each month rises as the daily average temperature increases, and falls as the daily average temperature decreases. Identify the independent and the dependent variables for this function. Answer: Temperature is the independent variable as it is unaffected by the amount of electricity used. Electricity usage is the dependent variable as it is affected by the temperature.
Independent and Dependent Variables Example 8-2b In a particular club, as membership dues increase, the number of new members decreases. Identify the independent and dependent variable in this function. Answer: Membership dues is the independent variable. Number of new members is the dependent variable.
Graphs and Functions Functions can be graphed without using a scale on either axis to show the general shape of the graph that represents a function.
Analyze Graphs Example 8-3a The graph represents the temperature in Ms. Ling’s classroom on a winter school day. Describe what is happening in the graph. Sample answer: The temperature is low until the heat is turned on. Then the temperature fluctuates up and down because of the thermostat. Finally the temperature drops when the heat is turned off.
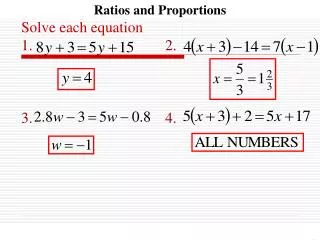
Analyze Graphs Example 8-3b The graph below represents Macy’s speed as she swims laps in a pool. Describe what is happening in the graph. Sample answer: Macy’s speed increases as she crosses the length of the pool, but then stops when she turns around at the end of each lap.