Download
1 / 26
260 likes | 370 Views
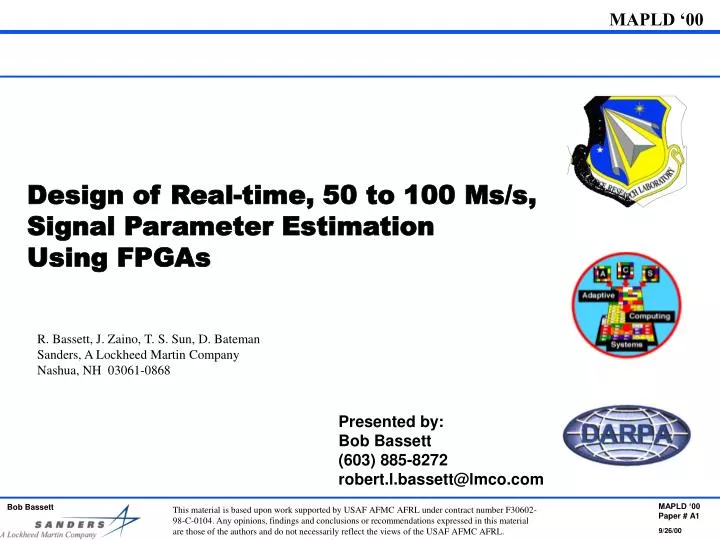
Design of Real-time, 50 to 100 Ms/s, Signal Parameter Estimation Using FPGAs. R. Bassett, J. Zaino, T. S. Sun, D. Bateman Sanders, A Lockheed Martin Company Nashua, NH 03061-0868. Presented by: Bob Bassett (603) 885-8272 robert.l.bassett@lmco.com.

E N D
Design of Real-time, 50 to 100 Ms/s, Signal Parameter Estimation Using FPGAs R. Bassett, J. Zaino, T. S. Sun, D. Bateman Sanders, A Lockheed Martin Company Nashua, NH 03061-0868 Presented by: Bob Bassett (603) 885-8272 robert.l.bassett@lmco.com This material is based upon work supported by USAF AFMC AFRL under contract number F30602-98-C-0104. Any opinions, findings and conclusions or recommendations expressed in this material are those of the authors and do not necessarily reflect the views of the USAF AFMC AFRL. 9/26/00
Topics • Reference Design • COTS Host Implementation • Rectangular to Polar Conversion • Noise Floor Estimation • Detection • Coarse Frequency Estimation • Magnitude Estimation • Time of Arrival Estimation • Matlab Modeling • Rapid Prototyping Process Use of FPGAs to implement Matlab modeled math functions in synchronous pipelines
A/D Reference design, a digital starring receiver Delay NB Filter Demodulator Filter Bank Digital LO Energy Detection Tune What does the signal look like? - Rectangular to polar conv - Noise floor estimation - Programmable detection rules - Coarse frequency estimate - Magnitude estimate - Time of arrival estimate Is a signal present? Where is it? Goals: 1. Exploit advantages in A/D technology 2. Explore size / performance trades and opportunities for approximation 3. Architectures for high sample rate processing (pipelining and parallelism) 5. Explore capabilities of high level design tools 6. Implement on COTS modules
COTS-Based Development Host 3 x Virtex 1000 WildStar PCI Currently running on single FPGA notebook based WildCard • UltraSpark 30 • Ptolemy • MatLab • WildStar • AAMETools (DARPA) Plans to migrate to triple FPGA workstation based PCI Wildstar • Matlab • Visual C/C++ • MS Office WildCard Virtex 300 Carry-on, Point of Collection AnalysisDesktop/Server Xilinx Xcv300 SRAM Memory SRAM Memory CardBus Interface Annapolis Microsystems Inc. WildCard PCMCIA Module PC
Components of Energy Detector Filter Bank (4 to 16 Channels) Rectangular to Polar Noise Floor Estimates Threshold Frequency Est Tune Command Arbitrator • Basic Architecture Trade-offs • Individual Channels • More space • Lower clock rates • Less power • Shared Pipelines • Space efficient • No variation between channels • Operates at original sample rate (Decimate filter bank channels by 1/N) • Model in MatLab and Ptolemy 50 Ms/S at I (12 bits), Q (12 bits) . . . . . . . . . . . . Amplitude & Time of Arrival Estimates
Basic Structure is Based on Synchronous Data Pipes • Synchronous Sample Delay Line • Magnitude • Phase Samples Noise Floor Estimator Detection Decision Coarse Frequency Estimator Tune Commands • Primary structure is a synchronous delay line providing samples at specific points of delay • Delay line is multiplexed among all channels • Why: • Ability to stream data continuously • Deterministic delays • Minimal interface logic
Function Diagram, Signal Parameter Measurement Magnitude Amplitude Rectangular to Polar Convert Create Desc Amplitude Measure I Q Signal Detection PW Pulse Width Measure Signal Descriptors TOA Time of Arrival Measure Frequency Frequency Measure Phase Bus Arbitration Timing and Control Synchronous pipelines run at incoming sample rates Control
Q Rectangular to Magnitude Polar Conversion I Phase Rectangular to Polar Conversion Issues Why: In- phase/Quadrature (I,Q or rectangular form) is convenient for sampling and filtering • Polar form (magnitude, phase), is convenient for thresholding and detection; i.e., magnitude is best for comparing to threshold. • Tradeoffs on the form of the magnitude to use for the detection law • Log (chosen approach) • Efficient use of word length (8 vs. 12 bit) and threshold computation (add vs. multiply) • Some loss in noise floor estimation (1 to 2 dB) • Linear • Optimal noise floor estimate • Square • Good small signal detection Accuracy approximation, usage dependent • Number of bits • Short (8 vs. 12 bits) normalized detection and coarse frequency only • Full small signal performance preserved • More efficient • Sufficient for detection and frequency estimation
0 0 0 0 1 1 0 0 0 1 1 1 Data 0 0 1 0 1 1 0 0 0 1 1 1 Data 1110 9 8 7 6 5 4 3 2 1 0 bit pos 1110 9 8 7 6 5 4 3 2 1 0 bit pos Rectangular to Polar Conversion Operation Log Magnitude=Log( \/I2+Q2) Phase = arctan (I/Q) • Table Lookup Approach • Flexible • Can change detection law and noise floor estimation method • Efficient (No divides, fewer bits flow out) • Easily pipelined to run at input sample rates • Can apply magnitude and phase correction to data via table Lookup Table Log Magnitude and Phase Reg Logic I (12) Q(12) 12 to 8 bits I (8) Q (8) Scale LMag (8) Phase (8) LMag (8) Phase (8) I (12 bits) Q (12 bits) Scale Factor Scale Factor 8 LSBs used for table look-up (when there are no higher bits) 4 MSBs determine scale factor Force to 0
Noise Floor Estimator, for 1 Channel Time and frequency cells are averaged to generate noise floor estimate Cell under test for detection. Guard cells Guard cells Time cells (8 + 8) • Range of magnitude values, 12 bits * 6dB/bit = 72 dB • 3 bits used to estimate noise, • leaving 72 - 18 = 54 dB for • signal dynamic range • (3 bits establishes an average value of 8) • Assumes an external loop that monitors our noise floor estimate and adjusts analog gain to maintain the desired noise floor value 72 dB Frequency Cells (16) 54 dB Noise floor set point 3 bits= 18dB 0 mag • Averages noise over 16 samples for each channel. • Split window provides for 8 samples (plus guard samples) on each side of the sample cell whose magnitude is tested against the signal detection threshold. • Averages over current frequency channel or (select-able), • the nearest 8 frequency channels excluding the current and adjacent channels • Total number cells used in noise floor estimate is 8 * (8+8) = 128 • Some of the input bits are used to measure noise in order to achieve the noise floor estimate. These bits are unavailable for signal dynamic range. For example, if the input is 12 bits, 3 bits are noise estimate and 9 are signal, resulting in a dynamic range of 54 dB not 72 dB (estimating 6dB per bit).
Reg ÷ 8 Reg Reg Integrate Incoming Samples Over Time, within FPGA, to Estimate Noise Floor Replicated twice per channel (2x16) Once before and once after cell under test Sample Pipeline Incoming Sample Magnitudes Reg sn-8 sn Acc = 0 1 8 Average = ((Acc + sn) - sn-8) - + Acc Noise Estimate Accumulator Noise Floor Estimate
Threshold via 2 Dimensional Conditional Map - Tailorable to Signals Being Detected • Declare Signal if: • It is larger than signals in adjacent frequency bins (>), and • It is the second sample received above threshold (X) (sufficient for frequency estimate), and • There was no signal above threshold 2 and 3 samples ago (O), (minimizes pulse fracturing). 3 x 5 Moving Map • Map Provides: • Mechanics for programmable detection rules • “Regular” test applicable across frequency and time slots • Mechanics for applying “Edge of Range” considerations < Frequency Slots (Filter Channels) x x o o < Time Slots (Samples) Cell Under Test for Detection
Magnitude-based Parameters, Amplitude and Time - of - Arrival Threshold based time of arrival estimates are dependent on magnitude estimate Leading edge slope Average magnitude to estimate amplitude Amplitude estimation Time of crossing 50% threshold determines TOA Profile of pulse magnitude
TOA Estimation, Some Issues Radar • Time of Arrival Estimate Techniques • Leading edge • Available earlier in pulse • Less susceptible to pulse on pulse corruption • Less susceptible to multipath • May get some jitter from scanning signals • Pulse Centroid (integrates over the duration of the pulse) • Needs entire pulse for measurement (difficult in dense signal environments where pulse on pulse conditions occur often). • Less susceptible to signal amplitude variations • Uses more of the available energy and information in pulse, and thus theoretically more accurate Leading Edge varies as magnitude varies Original Multipath Stretched Sum of original and multipath It is generally more important that the measurements be consistent than that they be exact. Use a technique that provide the most consistent answer.
FPGA Block Diagram; TOA Estimation Sample Data Memory Edge Detection Index to start of Pulse, Peak Amp, Noise Est Sample by Sample Operations Detection Queue Noise Estimator ComputationEngine Dual Port Memory Calculate Amplitudes for Reference Points Scan Edge for Qualifying Points Results Memory Calculate TOA Calculate Slope & Intercept Accumulate “Best Fit” Factors
Amplitude Estimation, Some Issues N Σ 1 N Amplitude = sn 1 Time series magnitude Plot, output of Rectangular to polar converter Amplitude: Average magnitude over a first N samples of the pulse after point of detection Amplitude Estimation Techniques - Average over the duration of the pulse, accurate but susceptible to pulse on pulse corruption - Peak from matched filter, accurate but requires knowledge of original pulse - Average over the first portion or center half of pulse - Estimate rise time, calculate pulse width or use a fixed delay to start of the integration window
High Accuracy TOA Measurement (April ‘00) Goals: High throughput 2x to 4x improved accuracy Challenges: Dependencies -- Noise floor est, Amplitude est Performance -- Sample by sample processing (in progress)
Frequency Measurement Using Phase I Q SAMPLE CLOCKS Q Rectangular to Magnitude Polar Conversion I Phase 1 Polar form frequency is rate of rotation of magnitude vector. 2 = arctan(I/Q) Estimate frequency by approximating. Frequency = d /dt as (2 - 1)/t. t • Goal is a simple estimator with 1/4 bin ( of 16 bins) accuracy. • Approach is average of phase over 5 samples (4 phases ). • Integrate over a binary number of samples, the divide by N is a binary shift of log N. • Represent angle as a binary number not degrees or radians. • Alternative techniques: • -- FFT; can handle more than 1 signal, but need to interpolate to achieve efficient resolution. • Considerations: • -- Coarse versus fine resolution, • -- One versus multiple signals.
Phase Angle is Ambiguous 6 4 2 0 Caution, phase angle is ambiguous 6 4 phase angle 2 0 Phase angle may range from 0 to n and beyond, but only the angles 0 to 2 can be represented (trigonometry). When calculating =n+1 - n, if n+1 < n then = +2 time samples
Some Results, Frequency Measurement of aLinear FM pulse Original LFM pulse - yellow Measured LFM signal - blue The output: Measured frequency and the error in measured frequency The input:: Magnitude and phase Can you see the signal?? Frequency error as a percentage of channel width A linear FM pulse Results using synthesized VHDL, next step, the FPGA The FPGA algorithm can see it.
Incoming Sample Phases 4 Σ 1 4ts Frequency = 1 Pipeline of delayed Phase differences - Reg Reg Reg Reg Reg + + + ÷ 4 Reg Frequency estimate Coarse Frequency Estimator logic sign Calculate phase difference between samples + 2 Integrate phase differences over 5 samples and divide by 4
Key functions of a Digital Channelized Receiver • Channelized filter bank • Signal detection • Parameter estimation • Iterate design alternatives • Quantization effects • Filter response • Noise floor estimation • Detection rules • Test cases • User definable (PRI,PW, Chirp etc.) • Multiple simultaneous signals • Noise levels • Multiple runs /Monte Carlo analysis Channelized Receiver Analysis and Visualization Tool (CRVT)Rapid Prototyping for Digital Receivers, Rapidly Iterate Alternative Designs and Test Cases
Rapid Prototyping Approach - Math Model to FPGA • Synthesize a set of signals of interest to analyze, establish performance requirements and to use as test vectors • Visualize results via Ptolemy and Matlab. Post process to establish output signal quality • Explore architecture and validate functionality using high level mathematical description. Reorganize math descriptions to model functional FPGA implementation; including quantization, rounding, overflow and dynamic range • Convert critical aspects to FPGA • Trade-off sizing throughput and performance • Test and verify using same data as used for analysis • MS-Excel is a rapid prototyping simulation and visualization tool
Transforming Algorithms to Hardware Still Requires Engineering • Match implementation to requirement specifications • Minimize expensive operations, e.g. multiplies and divides • Tune wordlengths to input and output specifications • Improvement can range from 2X to 10X • Substitute “approximate” algorithms to reduce hardware requirements • Tradeoff bit width for performance • Approximate computations • Restructure algorithm to take advantage of FPGA architecture • Concurrency • Bit level algorithms • Remap algorithms into lookup table versions • Directly implement systolic structures • Pipeline based processing • Combine conventionally generated VHDL component with tool generated components Tools automate the routine process tasks, provide visualization of results and speed iteration.
Test Bench Function Being Developed Performance Visualization RAPID Prototyping of RF Receivers with FPGAs; From Signals, Responses and Algorithms to Gates on Silicon Algorithm Analysis Requirements • SNR analysis • Alternative implementations • Functional approximations Floating Point Simulation Algorithm Rearrangement Bit Accurate Simulation Alternative Implementations Algorithm Rearrangement VHDL Modeling Alternative Implementations • Timing and sizing estimation • Scheduling – FSM and contexts • Partitioning Synthesis FPGA Realization Develop for Real Time test capability
Conclusions • FPGAs provide an excellent implementation host for RF signal processing • Newer devices promise to provide 4-100x the density, speed, and reduced power over those in the card we used • High sample rates, 50Ms/s to 100 Ms/s, can be supported through concurrent pipelined design • Care must be exercised in selecting bit widths and math functions • Low level decisions often have system level impact • Coupling high level simulation tool (Matlab, Ptolemy etc.) is essential to success • Emerging tools support rapid prototyping, moving quickly from algorithm to gates on card • Application areas include EW, Radar, and Communications • Work is still in progress