Download
1 / 30
300 likes | 432 Views
The Climate Change Classroom Toolkit, developed by experts at the National Earth Science Teachers Association, provides educators with essential resources to teach about climate change. This toolkit includes discussions on thermal expansion, CO2 sources and sinks, surface albedo effects, and the historical context of glaciers. Utilize hands-on activities to engage students in understanding the impacts of climate change, including rising sea levels, changing weather patterns, and ocean acidification. Empower students to grasp complex concepts surrounding our changing climate effectively.

E N D
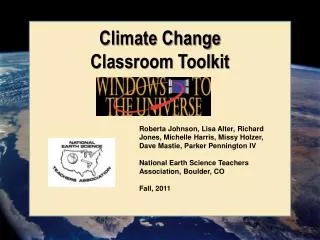
Climate Change Classroom Toolkit Roberta Johnson, Lisa Alter, Richard Jones, Michelle Harris, Missy Holzer, Dave Mastie, Parker Pennington IV National Earth Science Teachers Association, Boulder, CO Fall, 2011
Climate Change Classroom Toolkit • Brief introduction to Climate Change • Thermal Expansion and Sea Level Rise • CO2 – Sources and Sinks • Looking into Surface Albedo • Glaciers: Then and Now • CO2: How Much do you Spew?
What controls the climate? The Sun & Earth’s orbit Clouds Volcanic eruptions Reflective snow & ice And the amount of greenhouse gases…
● Sept 2011 Global average 389 ppm The rise has been relentless and shows a remarkably constant relationship with fossil-fuel burning, and can be well accounted for based on the simple premise that 57% of fossil-fuel emissions remain airborne. Here the number 57% was selected to fit the curve at the ends of the record, but what is significant is how well this link with fossil-fuel burning also fits the curvature in the record, sloping upwards less rapidly at the beginning, and more rapidly at the end. http://scrippsco2.ucsd.edu/program_history/keeling_curve_lessons_3.html
Earth is warming… ● Line plot of global mean land-ocean temperature index, 1880 to present, with the base period 1951-1980. The dotted black line is the annual mean and the solid red line is the five-year mean. The green bars show uncertainty estimates. Hansen et al., 2010-02-18, http://data.giss.nasa.gov/gistemp/graphs/, NASA GISS.
During the 20th century, Earth’s average temperature rose 0.6°C. • Some effects: • Arctic warming twice as fast • Changing precipitation patterns • Changing extreme weather events (droughts, heat waves, hurricanes) • Melting snow and ice • Longer growing season • Ocean acidity increasing • Sea level rise During the 21st century, models predict Earth’s average temperature will rise between 1.8 and 4.0° C. IPCC (2007)
Commonly Accepted Definitions refers to the current atmospheric conditions (including temperature, precipitation, wind, humidity, barometric pressure) at a particular time and place. • Weather • Climate refers to the general weather patterns expected in a given area (sometimes based on the 30 year average weather). Climate may also be applied more generally to large-scale weather patterns in time or space (e.g., an Ice Age climate or a tropical climate). Or, in the words of a middle school student…. "climate tells you what clothes to buy, but weather tells you what clothes to wear."
Thermal Expansion and Sea Level Rise Materials: Conical flask Rubber stopper- 2 holes Glass or plastic tube Thermometer Lamp 100-150 Watt bulb Water with food coloring We’ll set this up, and see what happens!
Carbon Dioxide – Sources and Sinks Students investigate how carbon dioxide gets into and out of the atmosphere using a chemical indicator (BTB). Materials for each group: Rack and 4 tubes 1 – vinegar 2 – BTB 1 –foil covered Stopper with tubing Cotton balls Baking soda Aluminum foil Straws
1. Make a small "boat" out of foil and fill 1/2 full of baking soda. Carbon Dioxide – Sources and Sinks Activity Part 1: Detecting Carbon Dioxide Gas (i.e., figuring out how this chemical indicator works) 2. Carefully slide the foil boat inside the vinegar test tube without spilling baking soda from the boat. Plug the test tube with the stopper and tubing. 3. Place the free end of the tubing into BTB. Place a cotton ball at the neck of the BTB tube. Mix the vinegar and soda gently. What happened?
Carbon Dioxide – Sources and Sinks • Part 2: Are animals a source of CO2? • Place a straw in a test tube of BTB. • Place a cotton ball in the test tube opening. • Gently blow in the straw. • What happened? • Part 3: Are plants a source of CO2? • Place a sprig of Elodea (or other water plant) into a test tube of BTB. • Wrap the tube in foil so that no light can get in. • Leave it for at least 24 hours. • Unwrap – what happened? • Part 4: Do plants take up CO2? • Place unwrapped test tube with Elodea from Part 3 in light for a day.
Carbon Dioxide – Sources and • Sinks Activity • Part 5: Are fossil fuels a source • of CO2? • Carefully untwist the tie of the exhaust filled balloon while pinching the balloon neck. • Insert a straw into the neck of the balloon while still preventing the gas from escaping. • Insert the other end of the straw into blue BTB. • Insert a cotton ball at the top of the tube. • Gently release air from the balloon.
Albedo • The albedo is the reflectivity of a surface. • Substances with a high albedo reflect light and stay cool • Substances with a low albedo absorb light and warm up • Snow, ice, and clouds have high albedo • Dark soils, asphalt, water, and forests have lower albedo • What is the impact of global warming on albedo?
Looking into Surface Albedo • Pick an photo • Read the temperature on two small thermometers • Tape the small thermometers below different colored parts of the photo • What happens to the temperature below the lighter and darker parts of the image after 3 minutes?
Looking into Surface Albedo • Activity shows that lighter surfaces, like the ice shown in the images, stay cooler than the darker parts of the image, where light is absorbed. • Which regions do you think have a higher albedo? Forests? Glaciers? Ocean? Farm Land? • What do you think will happen to temperature if ice is lost around the world? • Feedback loops • Positive – reinforcing, move systems away from equilibrium • Negative – damping, tends to maintain equilibrium
Cumulative balance of glacier mass in some regions Glacier mass balance During the 20th century, glaciers and ice caps have experienced widespread mass losses and have contributed to sea level rise Further decline of mountain glaciers projected to reduce water availabilityin many regions
Glaciers Then and Now • These glacier pictures were taken from the same place, but years apart. • Can you match up the pictures?
CO2: How Much Do You Spew? • Students analyze the energy consumption of a hypothetical household to determine the amount of carbon dioxide they are adding to the atmosphere each year. • Directions: • Each group has the a different family/individual described on their card. All these people live in different situations and use energy in different ways. • Read the information about the family’s energy use. • Use the worksheet to calculate their CO2 emissions. • Then, let’s discuss!
What’s happened to the Thermal Expansion Demo? What happens to sea level as ocean waters warm?
Sea Level Rise • The heat lamp heats the water in the flask, causing the water to expand slightly. • As the water expands, the level of the water goes up in the small tube, visually showing the expansion of the water. • As the Earth warms, its waters will also expand slightly. • As Earth’s atmospheric temperature rises from global warming, the oceans will warm and sea levels will rise from the expansion of the water, as well as from the addition of water from melted land-based glaciers.
Windows to the Universe Educator Newsletter Sign up now!
Classroom Activity Kits Available at the NESTA Trading Post Glaciers: Then and Now CO2: How Much Do You Spew? And online in the Windows to the Universe Online Store! Feeling the Heat – Part 2
www.windows2universe.org • Friday, November 11 • All events in Ernest N. Morial Convention Center, R09! • 8:00 – 9:00 am, Let’s Get Well Grounded! • 9:30 – 10:30 am, Climate Change Classroom Toolkit • 11:00 am - noon, Activities Across the Earth System • 2:00 – 3:00, NESTA Share-a-Thon • 3:30 – 4:30, NESTA Rock and Mineral Raffle! Session evaluations are available at http://www.nsta.org/conferences/evaluations
Please join us at the NESTA Share-a-Thon. 2-3 pm Rock and Mineral Raffle, 3:30 – 4:30 pm This room, today! Great classroom Activities! Rocks & Mineral Fossils & Maps Kits, and many other goodies! No one goes away empty handed!