Exercise
Exercise. Interpreting Radiosondes Mixing height calculator Using HYSPLIT Flowchart of good/poor air quality. Exercise – Interpreting Radiosondes (1 of 5). Instructions Determine the following for each day 850-mb temperature Inversions

Exercise
E N D
Presentation Transcript
Exercise • Interpreting Radiosondes • Mixing height calculator • Using HYSPLIT • Flowchart of good/poor air quality Section 10 Exercise
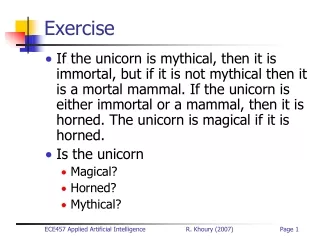
Exercise – Interpreting Radiosondes(1 of 5) • Instructions • Determine the following for each day • 850-mb temperature • Inversions • Afternoon mixing height based on morning temperature sounding and the given forecast maximum temperature • Afternoon mixing height on afternoon sounding • Answer the following questions • Did the mixing height estimate from the morning sounding match the mixing height determined from the afternoon sounding? • How would you expect morning and afternoon air quality concentrations to compare based on vertical mixing alone? • How would air quality concentrations compare between the days? • Time: 15 minutes Section 10 Exercise
Exercise – Interpreting Radiosondes(2 of 5) • Day 1 morning sounding • – forecasted maximum temperature: 33 °C Section 10 Exercise
Exercise – Interpreting Radiosondes(3 of 5) • Day 1 afternoon sounding Section 10 Exercise
Exercise – Interpreting Radiosondes(4 of 5) • Day 2 morning sounding • – forecasted maximum temperature: 31 °C Section 10 Exercise
Mixing height calculator Section 10 Exercise
Exercise – Interpreting Radiosondes(5 of 5) • Day 1 afternoon sounding Section 10 Exercise
Exercise – Using HYSPLIT • Instructions: Run backward HYSPLIT trajectories at various levels to determine possible transport sources. Experiment with the different options of the program (i.e., vertical motion scheme). • Time: 15 minutes Section 10 Exercise
Exercise – Flowchart • Instructions: Fill in a flowchart to identify conditions for both good and bad air quality. • Time: 15 minutes Section 10 Exercise
Upper-level pattern Vertical motion Surface pressure pattern Stability Wind strength Sky cover Inversion strength Amount of vertical mixing Amount of photochemistry Amount of horizontal dispersion Exercise – Flowchart Good AQ Section 10 Exercise
Upper-level pattern Vertical motion Surface pressure pattern Stability Wind strength Sky cover Inversion strength Amount of vertical mixing Amount of photochemistry Amount of horizontal dispersion Exercise – Flowchart Poor AQ Section 10 Exercise
Exercise – Map Discussion • Instructions: Have a local forecaster lead a map discussion, focusing on the features discussed in this section. • Time: 45 minutes Section 10 Exercise
![[Exercise Name] Functional Exercise](https://cdn0.slideserve.com/621913/exercise-name-functional-exercise-dt.jpg)

![[Exercise Name] Functional Exercise](https://cdn1.slideserve.com/1717560/exercise-name-functional-exercise-dt.jpg)


![[Exercise Name] Functional Exercise](https://cdn3.slideserve.com/6680259/exercise-name-functional-exercise-dt.jpg)

![[Exercise Name] Tabletop Exercise](https://cdn4.slideserve.com/9191716/exercise-name-tabletop-exercise-dt.jpg)
![[Exercise Name] Functional Exercise](https://cdn5.slideserve.com/9609621/exercise-name-functional-exercise-dt.jpg)