Download
1 / 28
280 likes | 455 Views
SBUSD Budget Workshop Fall 2014-15. Saturday, September 27 South Bay School Library (9-11AM) Presented By: Gary Storts, Superintendent Johnna Emery, Business Manager Lynette Kerr, Director of Fiscal Services at HCOE. SBUSD Mission Statement.

E N D
SBUSD Budget Workshop Fall 2014-15 Saturday, September 27 South Bay School Library (9-11AM) Presented By: Gary Storts, Superintendent Johnna Emery, Business Manager Lynette Kerr, Director of Fiscal Services at HCOE
SBUSD Mission Statement To prepare today’s student to succeed in tomorrow’s world by doing the following: Provide a safe, healthy and nurturing school environment Teach the skills necessary to prepare students for success in high school and beyond Instill in students a sense of personal and civic responsibility and global awareness Provide students with problem solving skills to thrive in a technological world Instill in students a desire to be lifelong learners
Today’s budget workshop Agenda - • Lynette Kerr – Director of Fiscal Services at HCOE • Process and Budget Timelines • SBUSD Budget – Past, Present and Future Projections • Pressures on the Budget
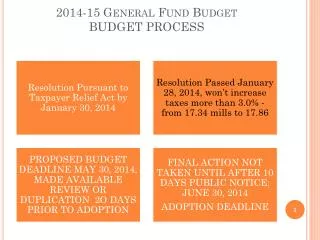
Budget Process and timeline • Building the SBUSD budget is a year around event, beginning in October with enrollment projections, and ending the next October when the district and school sites must have revised budgets. All activities are influenced by the CA budget process, budget “pressures” which vary from year to year, and change in employee compensation. • October – December • Enrollment projections for next school year are prepared • Business Manager uses current enrollment data & trending information to predict ADA • Business Manager provides best estimate of revenues • Enrollment projections drive allocations • 1st Interim Report Due to HCOE
Budget Process Timeline … • January - February • Start of State’s budget process • Governor releases state budget document • SBUSD gets first look at projected revenues (formal analysis) • State legislature begins budget process • March - May • 2nd Interim Report due to HCOE • Governor’s Office issues “MAY Revise” – more accurate look at CA revenues • District Office revises SBUSD budget • CA Legislature continues budget discussion
Budget Process timeline … • May – July • Legislature continues budget discussion • 3rd Interim (if required) • Constitutional deadline for CA Legislature to pass state budget bill • Governor must sign or veto the CA budget bill within 12 days of legislative action • Governor may use line-item veto to reduce or eliminate specific expenditures • Target date for the governor to sign the CA budget is June 30 of each year • SBUSD must pass budget by June 30 of each year – (CA Law) • Final CA budget will inform SBUSD what revenues to expect for the next school year • August • 45 Day Revise
SBUSD Budget - past, present and Future Chart of Accounts Trends over Time Where are We Going?
Chart of accounts • FUND – A self-balancing set of accounts, recording assets and liabilities. (Examples: General Fund, Charter School Fund, and Cafeteria Fund) • RESOURCE – “Where” did the money come from? Used to classify revenues & expenditures in accordance with restrictions or special reporting requirements placed on the LEA by law or regulation. (Examples: Lottery, Title I, Special Education, Transportation, After School Education & Safety) • GOAL – “Who” is the target audience? Define the broad purpose or objective(s) of the expenditure. (Examples: Regular Education, Administration, Special Education, Athletics) • FUNCTION – “What” activities or services will be provided? Describes the activities or services performed in order to accomplish the goal. Function refers to activities performed to support one or more goals. (Examples: Instruction, School Administration, Pupil Transportation, Maintenance)
Chart of accounts • OBJECT – “What” specific good or service is being purchased? What specific revenue is earned? This field applies to expenditures, revenues, and balance sheet accounts including assets, liabilities, and fund balances. (Examples: Teacher Salaries, Health & Welfare, Textbooks, Telephone Service, State Lottery Revenue) • SCHOOL – Designates a specific physical school structure or group of structures which form a campus. Refers to a physical location. (Examples: District, South Bay, Pine Hill) • MANAGEMENT – User defined code allows for internal tracking of expenses, projects, etc. This district has assigned staff their own code to track $300 lottery allowance. (Examples: Summer School, GATE, Playground, Pine Hill Portable)
Trends over time - revenues Revenues appear to be growing. 07/08 = 3,981,731 13/14 = 4,419,067 14/15 = 4,487,605 This is misleading. Includes fluctuating local revenues (fire insurance, etc.) Doesn’t take into consideration rising ADA, staffing demands, etc. Need to look at Revenue/ADA Revenue Limit Federal Revenue State Revenue Local / Misc.
Trends over time - revenues Revenues per ADA were highest in 2007/08. Bottomed out in 2009/10, then started climbing. 07/08 = 10,453 09/10 = 8,412 13/14 = 9,607 14/15 = 9,409 Still not back to 2007/08 levels per ADA, despite increased expenses and demands on schools. Does not include 86xx local revenues. Local revenues are not dependent on ADA, and fluctuate from year to year.
Trends over time - expenses Across General Fund, certificated salaries comprised 42% of the budget. Classified salaries comprised 17% of the budget. Benefits comprised 21% of the budget. Total compensation = 80% leaving 20% for materials and services. Certificated Salaries Classified Salaries Employee Benefits* Materials & Supplies Services Capital Improvements Other Outgo *Includes H&W, SUI, Workers’ Compensation, FICA, Medicare
Trends over time - expenses Across Operating Funds 01 and 09 (General & Charter), certificated salaries comprised 35% of the budget. Classified salaries comprised 18% of the budget. Benefits comprised 19% of the budget. Total compensation = 72% leaving 28% for materials and services.
Trends over time - expenses Across Operating Funds 01 & 09 (General & Charter) certificated salaries comprised 36% of the budget. Classified salaries comprised 19% of the budget. Benefits comprised 21% of the budget. Total compensation = 76% leaving 24% for materials and services.
Trends over time - spending Expense Vs. Revenues – Fund 01
Trends over time - spending Expense Vs. Revenues – Fund 09
Trends over time - reserves Reserve Level - % of Budget Reserves – Budgeted Amount
Trends over time – ADA Average Daily Attendance ADA drives funding as part of the LCFF calculation. Many of our students are interdistrict transfers. Charter enrollment is holding steady, but will likely increase. 2014/15 saw influx of 4th grade.
Where are we going? • REVENUES – LCFF changed the funding formula, making it challenging to predict how much to budget. CDE and DOF projections vary substantially (between $200k and $300k per year). • We will soon reach the 2007/08 funding level. • EXPENSES – Total Compensation (salaries & benefits) comprise 76% of the operating budget. This will continue to rise as STRS & PERS rates increase in the future. • In 2013/14 we substantially cut into our reserves by deficit spending in the amount of $281,472 in the General Fund and $72,747 in the Charter Fund. • In 2014/15 we anticipate deficit spending an additional $222,953 in the General Fund and $84,914 in the Charter Fund. • 2016/17 is the last year of the Charter School Loan payment of $50,000 annually.
Where are we going? • RESERVES – Our reserves are currently 11.55% for the 2014/15 fiscal year. We are required to maintain a 4% reserve. • Current projections show a decrease of approximately 1% per year in our reserves if we continue deficit spending at the current rate. • ADA – We currently have a healthy attendance rate. The charter school is averaging 97.38% attendance. Pine Hill is averaging 95.27% and South Bay is averaging 96.88% attendance. • If we maintain these rates, our revenues will increase. We budgeted for a lower attendance rate. • South Bay’s 4th grade class was unexpectedly large. This resulted in the need for a 4/5 combo class and a new teacher, which increased the certificated salary & benefits budget.
Where are we going? • INTERIMS / BUDGET REVISION – It’s time to revise & update the budget for 1st interim. It’s important to communicate any changes in funding, staffing, expenditures, etc. as quickly as possible in order to update the budget and plan accordingly. • This includes anticipated multi-year changes.
Pressures on the Budget Pressures on the budget vary from year to year for a variety of factors, including:
Pressures on the budget … • Increase in STRS & PERS Contributions • Facility needs and updates – what cannot be covered under Prop 39 • PH Cafeteria Floor (Williams Compliance finding) • Bus Barn (failing) • SB Parking Lot (failing) • Pine Hill Parking Lot Extension (safety) • Painting – PH & SB (school climate) • Plumbing (classroom 00 @ PH)
Pressures on the budget … • Special Education (cost rising) • Collective Bargaining • Salaries + Health & Welfare = Total Compensation • CA Rainy Day Fund • Proposition 98 Reserve Cap • NO more Common Core Implementation $ after 2014-15 • Proposition 30 (ends in 2018) • Sales Tax expires 12/31/2016 = 0.25% • Income Tax expires 12/31/2018 = 3% on top income earners
How to Stay out of the financial dog house • Common causes of financial problems: • Overly optimistic estimates of state economics • Overly aggressive estimates of enrollment, attendance, and average daily attendance (ADA) • Failure to document budget assumptions • Loss of control of staffing levels and costs • Underestimating “automatic” cost growth • Use of one-time money for ongoing expenses • Poor decisions at the negotiating table • Failure to consider multiyear impact of budget decisions • Failure to follow through on budget decisions • Poor budget monitoring • Chronic deficit spending • Inadequate reserves
Final thoughts … • Things are getting better, BUT funding is still less than 2007-08 • Local Control does NOT mean “no regulations” • The Strategic Planning Process will help determine who we want to be, thus dictating how we budget… so please show up – Oct. 18, 2014