Dietary Reference Intakes
430 likes | 472 Views
Dietary Reference Intakes. What Dieticians Need to Know. Dietary Reference Intakes. examples: vitamin C and calcium. DRI Process. North American Initiative Institute of Medicine and Health Canada Each panel has at least 1 Canadian Canadians review draft document

Dietary Reference Intakes
E N D
Presentation Transcript
Dietary Reference Intakes What Dieticians Need to Know
Dietary Reference Intakes • examples: vitamin C and calcium
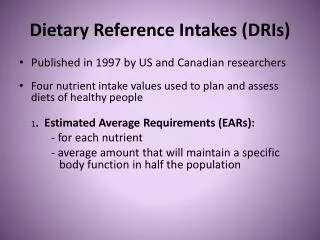
DRI Process • North American Initiative • Institute of Medicine and Health Canada • Each panel has at least 1 Canadian • Canadians review draft document • Intended to replace 1989 RDAs and 1990 RNIs • Not just traditional nutrients
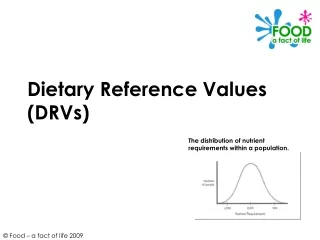
Components of the DRIs • Four values instead of one • These are: • EAR: Estimated Average Requirement • RDA: Recommended Dietary Allowance • AI: Adequate Intake • UL: Tolerable Upper Intake Level • How derived? How Interpreted?
EAR and RDA values • EAR • obtain scientific data to estimate the average requirement for a nutrient • Add 2 SD to this value so that 98% of popn has their requirement met • Resulting value is RDA • RDA = EAR + 2 SD
EAR and RDA (cont) • In preceding diagram, EAR set at 45 units • RDA is 63 units • Therefore, RDA = EAR +2(9) • MOST nutrients: RDA = EAR + 2(10%) • Can be written as RDA = EAR x 1.2
Use of DRIs • Apply to healthy people • RDA is generous: covers 98% of popn • Compare to usual (average) intake, not intake on any given day • RDA is goal for an individual • EAR used to assess groups
Nutrients Without an EAR – Do Not Have RDA • Need scientific studies to determine EAR • Nutrients without EAR do not have an RDA • Instead: given an AI • Used as goal for individual (~ RDA) • We cannot assess groups using an AI • Calcium, Vitamin D, Fluoride, Biotin, Pantothenic acid (and all infant values)
Nutrients Recognized as Toxic • UL value assigned to many nutrients • Often based on case reports, not studies • Value at UL has no risk • Risk increases with higher intake • sustained intake not a single dose (except Mg)
Vitamin C Has an EAR Has an RDA Has a UL Important yet not much is known Calcium No EAR Has an AI Has a UL Important but controversial Examples to Illustrate DRIs
Vitamin C • Many functions: • Enzyme cofactor for collagen synthesis • Involved in synthesis of hormones, neurotransmittors • Now recognized as important anti-oxidant • Increases Fe absorption • In cells plasma urine excretion • in specialized tissues: WBCs
EAR and RDA for Vitamin C • EAR = 75 mg for adult men 60 mg for women • Based on following study: • 7 healthy men lived in for 6 months • Fed low C diet (5 mg/d) until depleted • Given graded doses until steady state reached • Measured serum, neutrophil, and urine ascorbate
EAR for Vitamin C • At 100 mg, neutrophils were saturated with acorbate in 4/7 subjects, but urine excretion was high (25% of dose) • At 60 mg, neutrophils were not quite saturated, but urine excretion 0 % • Panel chose value between 60 and 100 => 75 mg, as level of “adequate” vitamin C levels in WBCs
How do we assess Vitamin C adequacy? • Find usual intake of vitamin C in population • The percent of the pop’n whose intakes are below EAR = % at risk for inadequacy • In following figure, North Americans have some risk of inadequacy: • ~ 10-20% ingesting too little
Vitamin C RDA • Use RDA as a goal for an individual • RDA = EAR + 2 SD • Men: RDA = 75 + 2(7.5) = 90 mg • Women: RDA = 60 + 2 (6) = 75 mg (rounded) • Smokers – need more • Add 35 mg to RDA
Vitamin Toxicity • Many “problems” attributed to vitamin C • Excess urinary oxalate excretion, increased uric acid excretion in urine kidney stones • Pro-oxidant • Fe absorption iron overload • serum B12 • Rebound scurvy • DRI panel found no evidence for anything except GI disturbances (osmotic diarrhea)
UL for Vitamin C • Uncontrolled cases and several controlled studies show that some people get GI disturbances at >3 g • 3 g = LOAEL • Since UL is set so no risk of adverse effects, Then UL = 3/1.5 = 2 g (~ NOAEL)
Calcium • Panel chose “desirable daily calcium retention” as criterion for setting AI • Retention is classically measured as calcium balance (Intake – Losses); assume what is retained is in bones • Now, can directly measure bone mineral content BMC ~ mineral in bone
AI for Calcium • Age 19-30: retain 10-50 mg/day, estimate 957 mg intake from old balance studies • “Judge” 1000 mg to be appropriate • At older ages (50+): clinical trial data shows less bone loss at intakes > 1000 mg • Account for less absorption at 50+ • Value set at 1200 mg
UL for Calcium • Whiting and Wood compiled case reports of “milk-alkali syndrome” in 1995 (NR ’97) • Other problems of excess Ca = kidney stones, iron absorption, Zn retention • LOAEL = 5 g (in otherwise healthy) • UL = 5g/2 = 2.5 g
Introduction to energy (nrg) balance As far as energy in the body goes it is a case of constant spend (catabolism or breakdown of energy yielding nutrients) and refill (anabolism or build up of energy yielding nutrients Not all excess energy in is stored-some extra energy is used for maintaining extra body weight Slow weight loss desirable –otherwise get the yo-yo effect - diet and exercise is the key to proper weight management
Energy in governed by a) and b) a) Food composition-calories in food b) Amount of food intake driven by: Hunger Satiation Satiety Overriding hunger and satiety signals
Energy in Food composition Food composition – the more carbohydrate, lipid and/or protein in food consumed the greater the amount of energy consumed O2 helps to make energy from food and, in that sense, oxygen is a nutrient even though the oxygen in food does not contribute to metabolism of the carbohydrate, lipid and protein in food
Energy in Food intake governed in part by hunger -in part hunger depends on food content of stomach: -smaller stomach requires less food to fill it -larger stomach requires more food to fill it -stomach fullness of course stops hunger -hunger also depends on receptors in the gastrointestinal tract that determine whether nutrient intake has been high or low and this also signals whether one is still hungry
ENERGY INTAKE CONTINUED FOOD INTAKE ALSO CONTROLLED BY: Satiation and Satiety Satiation signal says-when to stop eating Satiety signal says-do not start eating again Overriding hunger and satiety signals due to: boredom, stress, time of day, availability of food sight, and/or taste of food all of which may cause us to continue to eat
Energy out Components of energy expenditure Basal metabolism Physical activity Thermic effect of food Adaptive thermogenesis
Energy out continued 50 % dietary Kcal goes to make ATP and the rest of dietary Kcal radiates as heat 50 % of ATP goes to work and 50 % of ATP goes to heat therefore only 25 % of dietary kcal used for work Basal metabolism Just to keep the doors open and the heat and lights on -calculated as weight (lbs) x 10 cal/lb
ENERGY OUT CONTINUED Physical activity amount of energy expended depends on in direct proportion to body mass and activity (duration, frequency and intensity). Thermic effect of food-energy utilised to digest absorb and transport and store nutrients Adaptive thermogenesis-energy consumed during shivering Adaptation to stress (e.g. exercise) - body needs extra energy to build tissues
GRAND TOTAL ENERGY OUT 2200 kcal/day for females 2900 kcal/day for males
Measures of body fat distribution BMI BMI =kg/m2 underweight <18.5 correct 18.5-24.9 overweight > 25 - 29.9 obese > 30 BMI is not a good measure of body fat distribution
Measures of body fat distribution Waist circumference Europid Males > 94 cm - increased risk of heart disease, type 2 diabetes, stroke, cancer (including but not limited to colon, prostate, breast) Europid Females > 80 cm-risk - increased risk of heart disease, type 2 diabetes, stroke, cancer (including but not limited to colon, breast) Waist circumference is a good measure of body fat distribution-particularly good measure of the extent of visceral fat
Health risks associated with body weight and body fat Health risks of underweight • Tougher to preserve lean tissue against wasting • Infertility • Giving birth to unhealthy infants Health risks of overweight • Atherosclerosis(stroke) • Diabetes-type 2 diabetes already discussed • Cancer- weight and weight gain tied in here- not fully understood why- may be related to hormones
Supplements alleged to control body weight -all claims are false!! Ma Huang-herb containing ephedrine alleged to induce weight loss Chromium picolinate-alleged to burn fat Spirulina-powder from algae-alleged to suppress appetite Guar gum -alleged to suppress appetite by absorbing water and bloating stomach Gymnena Sylvestre plant-claimed to block sugar absorption
Energy control (diet) and exercise combined are the best way to control body weight and hence health. Energy control (diet) and exercise combined prevent excess body fat related diseases